Dr. Agarwal's Health Care: The Eye Care Empire That Changed Indian Healthcare
I. Introduction & Cold Open
Every weekday morning, across fourteen Indian states, five union territories, and nine African countries, roughly 12,000 patients walk into a Dr. Agarwal's facility seeking treatment for failing vision.2 Most arrive for the same reason people have visited eye doctors for centuries: the lens inside the eye has clouded over, soft blurriness has set in at the edges of their sight, and the procedure to fix it — removing the clouded lens and replacing it with a synthetic implant — takes about fifteen minutes.
That fifteen-minute procedure, performed roughly 67,000 times in a single quarter, serves as the economic engine for a business that generated ₹614 crore of revenue in the three months ended June 2026 and operates 304 facilities.1 The company has built its model around routine high-volume surgery, scaled operations with the discipline of a retail chain, and backed the platform with capital from major global private equity firms.
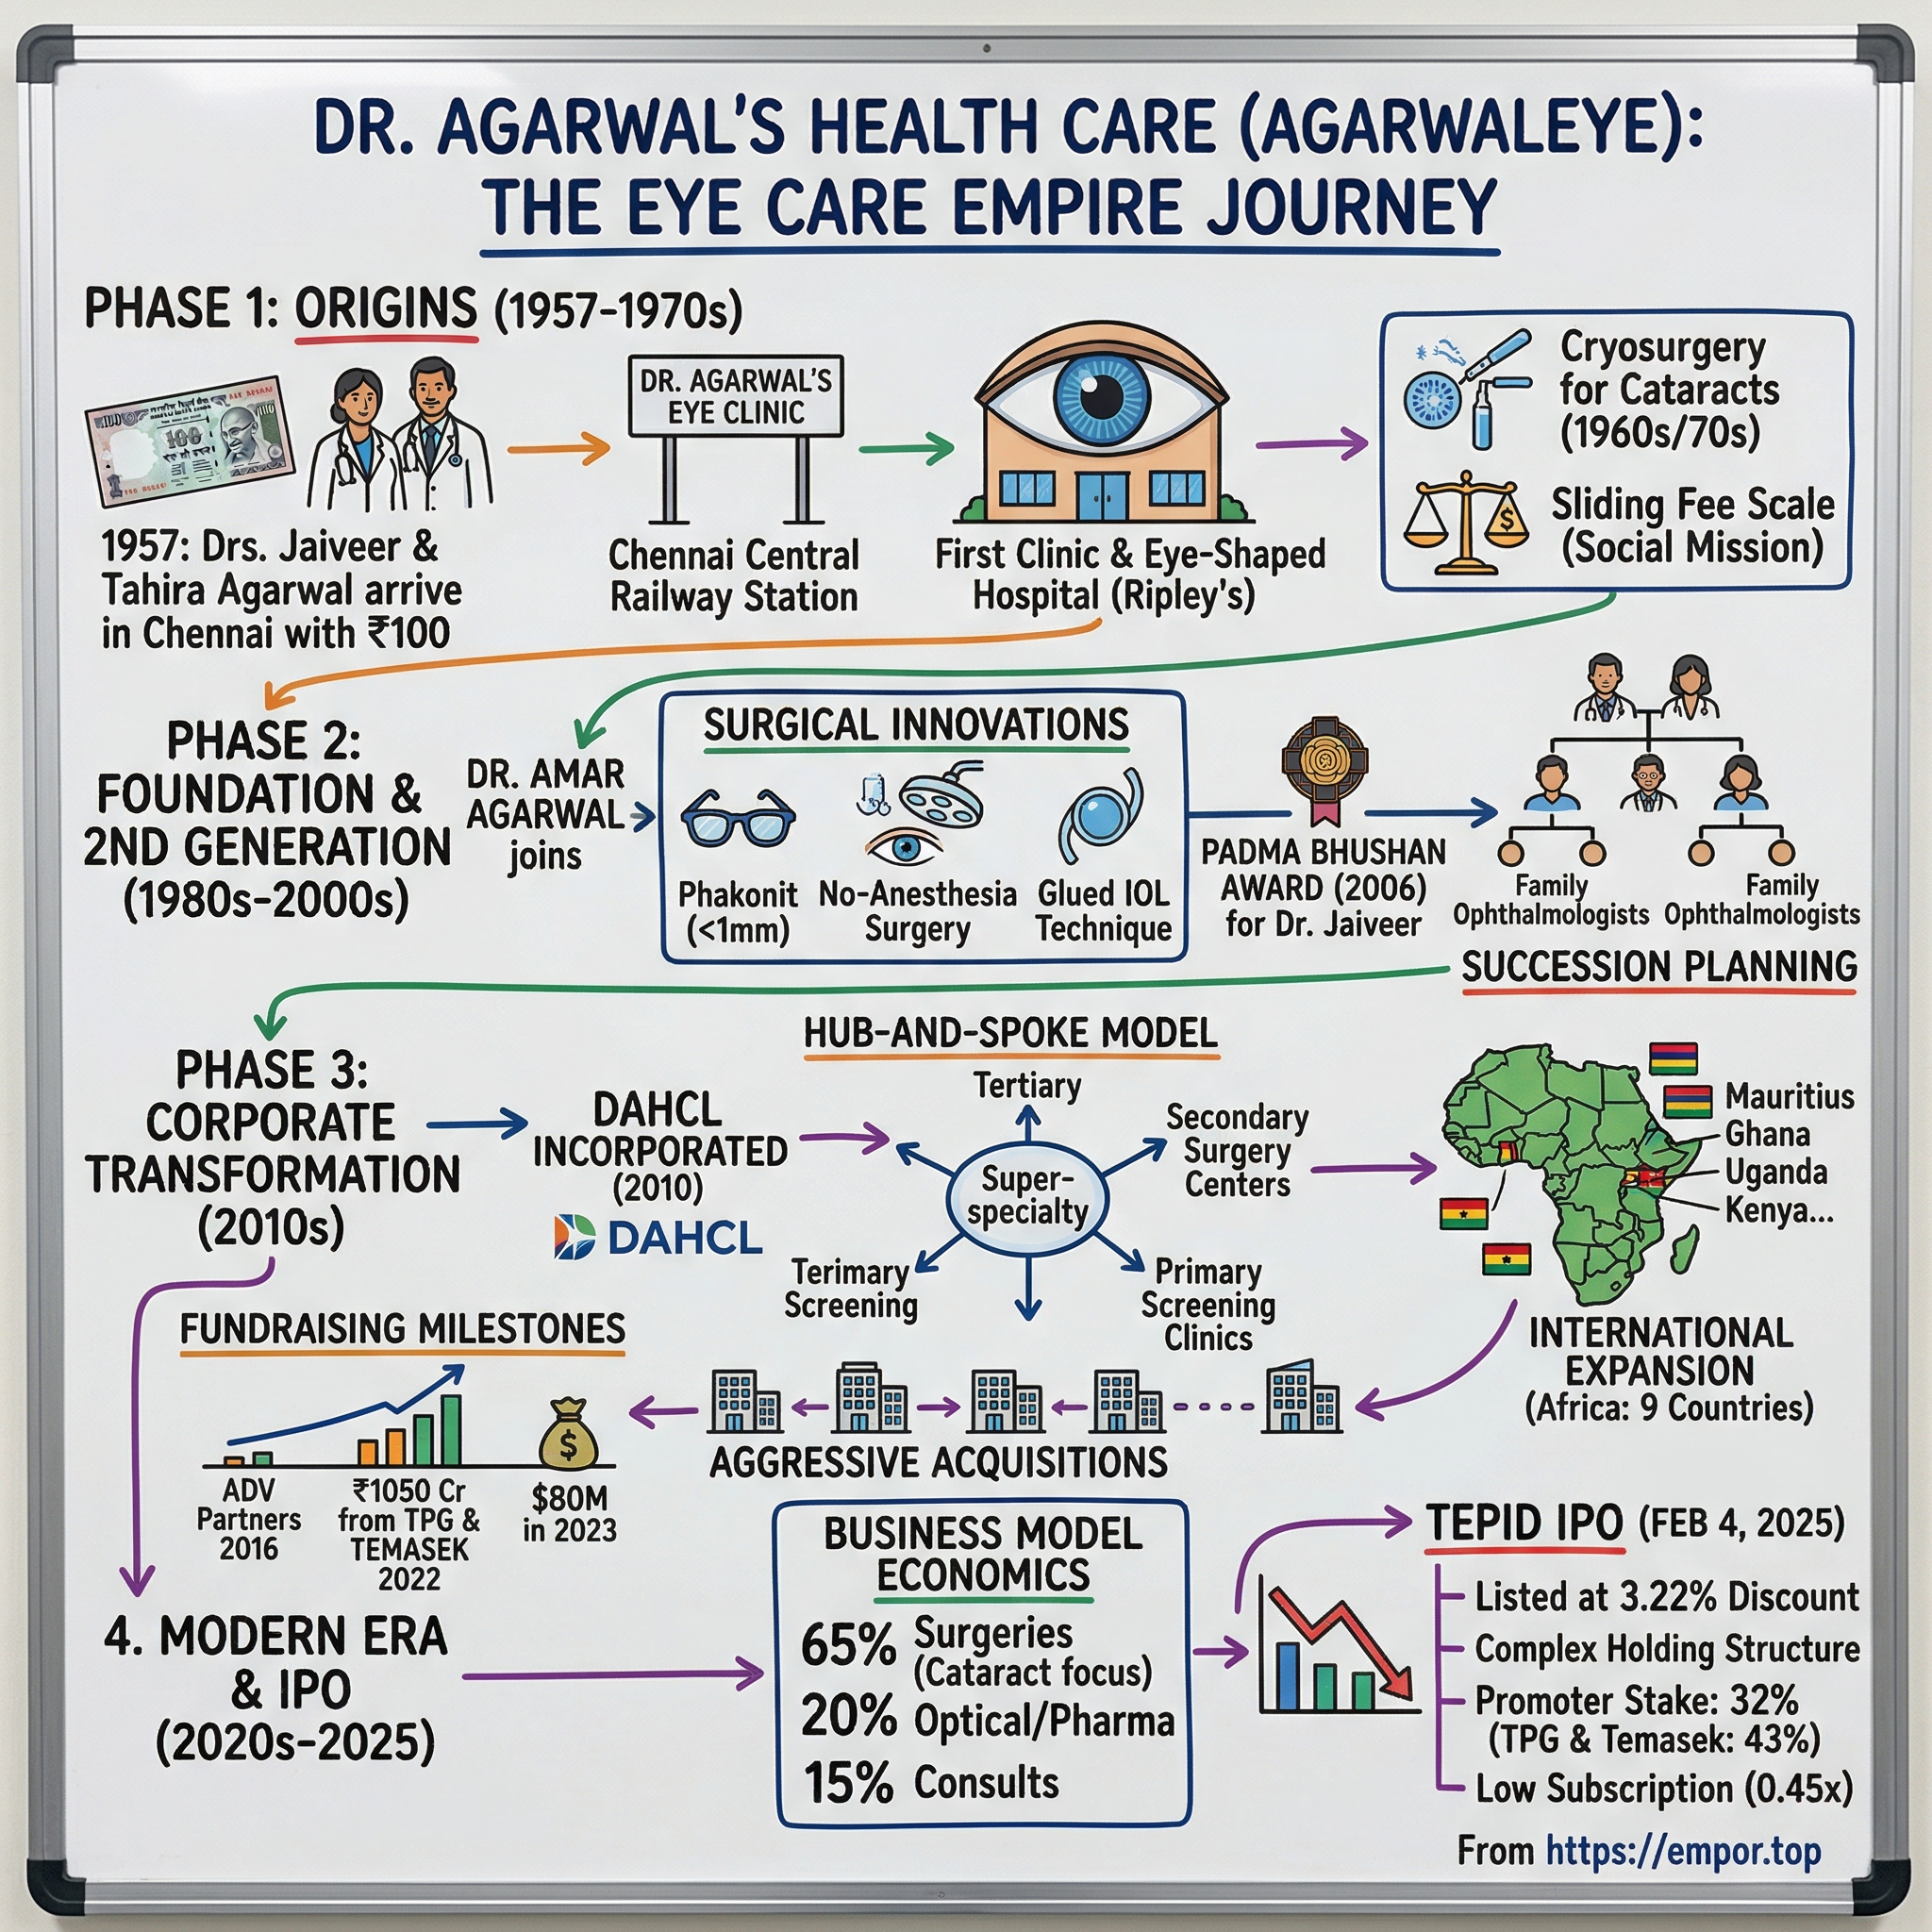
The origin story follows a classic medical lineage. In 1957, Dr. Jaiveer Agarwal and Dr. Tahira Agarwal established a small eye practice in Madras.11 Nearly seventy years later, their descendants run India's largest eye care chain by revenue, with the family name listed on both major Indian stock exchanges.
The listing paradox. In February 2025, the parent company, Dr. Agarwal's Health Care Limited, completed a ₹3,027 crore initial public offering.7 Only ₹300 crore — roughly one-tenth — represented primary capital for the business itself. The remaining ₹2,727 crore was an offer for sale, allowing private equity sponsors TPG and Temasek, alongside promoter family members, to monetize part of their holdings.5 Public market demand was muted: the issue was subscribed 1.55 times overall, with retail investors bidding for just 0.41 times their allocation and non-institutional investors 0.40 times.8 Institutional buyers carried the book, and the stock listed flat.
In the eighteen months since the IPO, the corporate narrative has evolved beyond initial expectations. Originally viewed as an acquisition-driven roll-up, the company halted acquisitions almost entirely — 100% of facility additions in FY26 and in the first quarter of FY27 were greenfield developments, built from scratch.42 Skeptics had also argued that lease accounting rules would permanently depress earnings, yet net margin expanded from 6.4% in FY25 to 8.9% in the June 2026 quarter.1 Meanwhile, criticisms of a complex holding-company structure involving a separately listed subsidiary are being addressed: management told analysts in August 2026 that the internal merger should close around mid-November 2026.2
While certain IPO-era concerns have proved overstated, new operational realities have emerged. Ramp-up losses from greenfield expansion, ongoing capital demands for surgical technology, and private equity sponsor overhang being unwound through block deals now sit at the center of the investment thesis.
Where this goes. First, the clinical origins and surgical innovations that established the brand. Second, the corporate transition from a family practice to an institutionally owned platform. Third, the shift from aggressive acquisitions to organic network expansion. Fourth, the core unit economics: cataract profitability, lease accounting impacts, and capital allocation. Fifth, the post-IPO capital markets record. Finally, the competitive landscape, moat durability, corporate governance, key operational risks, and the bull and bear cases for the stock.
What is actually at stake. Dr. Agarwal's represents the clearest listed test case in India of a single-specialty healthcare roll-up operating at scale in public markets. Whether a chain can standardize surgical procedures across 165 cities without degrading clinical quality or referral relationships remains an open question. Early data shows positive volume and pricing trends, but returns in expansion geographies remain unproven, and market performance stays tied to how smoothly remaining private equity stakes are absorbed.
The story starts, as most Indian medical dynasties do, with a building.
 Subscribe on LinkedIn
II. Origins & Second-Generation Clinical Innovations (1957–2000s)
Chennai's Cathedral Road carries the usual dense mix of a South Indian metropolis — banks, schools, a cathedral. And, since December 1976, a building shaped like a human eye. The white sclera curves out to the street; the iris forms the entrance. It is the kind of architectural gesture that a modern marketing consultant might advise against, yet it proved to be the single most effective brand investment the family ever made. A patient in Tamil Nadu did not need to remember a corporate name; they only needed to remember the building shaped like an eye.
That landmark was the physical expression of a practice established nineteen years earlier. Dr. Jaiveer Agarwal and Dr. Tahira Agarwal founded their eye practice in Madras in 1957, framing their mission around ethical clinical practice and compassionate care.11 What validated that initial mandate was how the founders spent the next four decades.
They ran eye camps — thousands of them. According to family accounts, Amar Agarwal — the founders' son who later assumed leadership — participated in more than 5,500 camps that treated over 500,000 patients and performed more than 200,000 free surgeries.12 For a business analyst, this charitable engine was not merely philanthropic; it served as the core customer acquisition strategy. Rural Tamil Nadu encountered the brand in a context free of commercial sales pressure, building trust that converted over decades into paying referrals at the Chennai hospital. That organic reputation represents a durable form of brand equity that is difficult for a private-equity-backed entrant to replicate on a five-year investment horizon. Dr. Jaiveer Agarwal received the Padma Bhushan, India's third-highest civilian honor, in recognition of that work.11
The second generation was where the family stopped being locally famous and started being globally cited.
Amar Agarwal earned his MS in 1986 from Civil Hospital Ahmedabad, followed by an FRCS from Edinburgh the same year and an FRCOphth from London in 1988.12 Returning to Chennai, he spent the next two decades pioneering surgical techniques that gained adoption among Western ophthalmologists.
To understand the economic significance of these developments, consider the mechanics of cataract surgery. The natural lens sits inside a thin, transparent capsule. A surgeon creates an incision, breaks the clouded lens into fragments using ultrasound, suctions out the material, and inserts a foldable artificial lens into the empty capsule. Procedural success relies on minimizing incision size to accelerate healing and prevent visual distortion, while preserving the structural integrity of the capsule.
Agarwal addressed both constraints. In 1998, he pioneered phakonit — phacoemulsification performed through a needle incision — and by the mid-2000s reduced the tip diameter to 0.7 millimeters with microphakonit, creating an incision narrower than mechanical pencil lead.12 On June 13, 1998, at a conference in Ahmedabad, he performed a cataract operation with no anesthesia before an audience of 250 surgeons — without topical or intracameral numbing.12 In 2007, he became the first surgeon in the world to implant a glued IOL: securing an intraocular lens with fibrin tissue glue in an eye whose capsular bag was destroyed or missing.12 Prior to this technique, patients with severe ocular trauma or surgical complications had limited options; glued IOL established a standardized, repeatable solution.
Alongside these three surgical techniques, Agarwal places equal emphasis on an unglamorous process innovation suggested by his sister, Dr. Sunita Agarwal: an air pump that maintains pressure inside the eye during surgery so the chamber never collapses.12 "The reason I consider the air pump so important is that surge never occurs," he told an ophthalmology trade publication.12 A low-cost device that mitigates the single most critical surgical risk — a ruptured posterior capsule — represents the type of process standardization that can scale efficiently across hundreds of operating theaters.
Why does any of this matter to an investor in 2026? Because clinical reputation functions as an institutional referral engine. Complex conditions — corneal disease, retinal detachment, and high-risk cases turned away by general practitioners — are routinely referred to the network by external ophthalmologists. These referrals support tertiary surgical centers, which in turn anchor academic training programs. Those programs train the surgical talent that staffs secondary centers, where high-volume cataract procedures drive the core revenue of the enterprise.
The company continues to execute this operational playbook. In FY26, the network performed roughly 1,150 corneal transplants and over 12,800 retinal surgeries.3 It maintains postgraduate training programs in Chennai, Tirunelveli, and Cuttack, alongside a facility in Navi Mumbai, and operates its own schools of optometry.3 The clinical team's latest innovation is pinhole pupilloplasty (PPP), developed by Amar Agarwal and his clinical team: a technique for restoring vision in eyes with severe corneal injury without requiring a donor cornea.1 On an August 2026 earnings call, Chief Executive Officer Adil Agarwal offered an ambitious analogy, comparing PPP's potential impact on corneal transplantation to what the coronary stent was to bypass surgery.2
That ambitious claim warrants scrutiny. Disclosures show roughly 500 procedures performed in FY26, with about 94% of patients showing meaningful improvement in visual acuity, supported by peer-reviewed publications and conference demonstrations.1 Relative to the network's 323,000 total annual surgeries, 500 procedures represent a negligible financial contribution today. What PPP does reliably, however, is what glued IOL did two decades ago: maintaining the firm's global clinical standing, sustaining referral funnels, and attracting surgical talent to the network.
By the late 2000s, the family had built a formidable clinical asset and a recognized regional brand, but operated under a structure that could not scale nationally. Hospitals were spread across multiple corporate entities, and growth depended on internal family capital. Expanding from a regional institution into a nationwide network required a new corporate architecture and private equity partners — a transition that began by rebuilding the company from its corporate charter up.
III. The PE Roll-Up Era & Institutionalization (2010–2020)
Every family business that accepts institutional money crosses the same threshold, and it is rarely on the day the wire arrives. It is the day the founders accept that the enterprise they built will now be evaluated by investors who have never met a patient.
For the Agarwals, that pivotal moment arrived in 2010, when the group reorganized its operations under Dr. Agarwal's Health Care Limited — creating a holding structure capable of taking on outside equity without fragmenting family control over clinical practice.5 Two years later, the first institutional capital arrived from InvAscent and British International Investment (then CDC Group). This was patient development capital, comfortable with long ramp-up periods and a business whose clear social benefit made its impact simple to underwrite.
The nature of that capital shifted in 2019, when Singapore sovereign investor Temasek invested ₹270 crore to buy out early backers and finance nationwide expansion. The institutional presence deepened in 2022 when TPG Growth invested alongside Temasek. By the time the group filed its offer document in September 2024, TPG's investment vehicle, Hyperion Investments, held 33.75% of pre-issue capital at an average acquisition cost of ₹273.70 per share. Temasek held its position through two entities: Claymore at 15.73% with an average cost of ₹125.40, and Arvon at 12.45% at ₹288.65.5 Together, the two sponsors controlled more than 60% of a company still managed day-to-day by the founding family.
Those acquisition costs offer a clear look at what the private equity sponsors were underwriting. Claymore's ₹125 cost basis reflected Temasek's earlier, lower-valuation entry, while Hyperion's ₹274 and Arvon's ₹289 reflected the higher valuation of the 2022 funding round. When the IPO priced at ₹402 per share, TPG was holding an unrealized gross paper return of roughly 1.5 times after two years — respectable, but modest compared to typical buyout headlines. The math shows the sponsors were not looking to flip a cheap asset, but rather buying an established platform at full price on the conviction that they could rapidly scale its facility footprint.
The operating architecture that money bought.
The platform was built on a hub-and-spoke model. As of June 2026, the network comprised 89 primary facilities, 179 secondary facilities, and 36 tertiary facilities, including four designated Centers of Excellence.1
A primary facility functions as a front door: equipped with basic diagnostic tools, an optometrist, and teleconsultation links to remote doctors. It does not perform surgery. Its function is to identify patients locally at the first sign of visual impairment and route them upward through the network.
A secondary facility serves as a regional surgical center, handling cataract procedures, pre-operative diagnostics, and mid-level clinical work. This tier generates the bulk of procedural volume and revenue.
A tertiary facility delivers comprehensive care, including vitreo-retinal surgery, corneal transplants, and advanced refractive procedures. While capital-intensive to build and staff, these centers act as clinical anchor institutions and referral magnets for their surrounding regional clusters.
The core advantage of this structure is that medical talent and high-end equipment move dynamically across the network while patients flow inward. A single retinal specialist based at a tertiary hub can serve multiple secondary centers, while a high-cost femtosecond laser in one facility can be scheduled for patients drawn from across a dozen locations. In Chennai, the company established a dense regional grid — spanning Ambattur, Avadi, Perambur, Anna Nagar, Porur, Adyar, Velachery, Tambaram, Chengalpattu, and neighboring suburbs — with all locations feeding into a central group of surgical hubs.1
Crucially, the expansion model remains asset-light on real estate, with the company leasing all but one of its operating facilities.1 Rather than purchasing land, upfront capital is directed into medical equipment and facility fit-outs — investments that are movable, depreciable, and significantly less capital-intensive than multi-specialty hospital real estate. This capital allocation choice forms one of the central drivers of the company's financial structure, with its income statement impact examined further in Section V.
Africa, quietly.
While building its domestic presence, the group expanded internationally, beginning in Mauritius in 2012 and growing under the Orbit Healthcare banner into Ghana, Kenya, Uganda, Tanzania, Zambia, Mozambique, Rwanda, and Madagascar.5 By June 2026, international operations encompassed 19 facilities across nine countries, contributing 10.1% of total revenue.1
The business rationale is straightforward: these markets feature substantial unmet clinical demand, limited organized competition, and frequent dollar-linked pricing. However, managing nine small international operations — each with its own regulatory environment, currency risk, and healthcare workforce — creates significant operational complexity for a division generating one-tenth of company revenue. International revenue grew 20.8% in FY26, matching overall group growth.3 While providing steady, profitable geographical diversification, the African operations represent long-term optionality rather than the primary driver of overall corporate expansion.
By 2020, the foundation was complete: a corporate structure designed to absorb institutional capital, a repeatable operating model, and private equity sponsors committed to accelerated expansion. What followed was a period of rapid network acquisitions — before management unexpectedly shifted strategy.
IV. M&A Aggression & Capital Deployment (2020–2024)
On October 8, 2021, Dr. Agarwal's opened its hundredth hospital. The company did not build the facility; it acquired it.
Aditya Jyot, a four-story facility in Wadala, was Mumbai's first NABH-accredited eye hospital. It was founded in 1990 by Dr. S. Natarajan, a third-generation ophthalmologist who had performed over 60,000 retina surgeries, trained more than sixty retinal specialists, and earned induction into the American Society of Retina Specialists' Retina Hall of Fame.13 Following the transaction, Natarajan assumed the role of Chief of Vitreo Retina Services for the entire group.13
That transaction captured the roll-up playbook in miniature: acquiring a practice built around an eminent surgeon secures both the clinician's prestige and an established referral network. Once integrated into a standardized corporate platform, a single acquired clinic can anchor a regional cluster. At the time of the deal, management outlined plans to deploy more than ₹300 crore across twenty hospitals in Maharashtra as part of a broader ₹1,000 crore strategy to reach 200 hospitals nationwide within three years.13
A similar acquisition logic drove expansion into other regional markets. The company entered Gujarat, established a platform in Punjab through a joint venture that became a controlling stake in Dr. Thind Eye Care, bought bolt-on practices including R K N Eye Care and Eydox Eye Hospital, and acquired an ophthalmic business in Varanasi to enter Uttar Pradesh.5 By the time the group filed its offer document, the network encompassed five direct subsidiaries in India and eight indirect operating entities in Africa.5
What acquisitions actually cost — the part that shows up years later.
Regulatory disclosures expose a structural feature of clinic roll-ups that receives little attention: acquisitions were rarely funded through a single upfront payout. Instead, purchase prices were structured in multi-year tranches, contingent on the selling surgeon remaining with the firm. The offer document outlines a representative structure: 50% paid within one month of closing, 25% at twelve months, and the final 25% at twenty-four months, subject to the clinician's continued service.5
These deferred payments sit on the balance sheet as liabilities and accrue interest charged to finance costs, creating a predictable debt schedule from past M&A. As these obligations are satisfied, cash outflows and interest charges decline. The group disbursed approximately ₹85 crore for acquisition payables in FY26 and guided to ₹60–65 crore in FY27, with a remaining ₹60 crore scheduled between FY28 and FY30.3 Interest on deferred acquisition liabilities fell from about ₹6.8 crore in the June 2025 quarter to ₹3.6 crore in the June 2026 quarter following a ₹25 crore payment.2
This unwinding of M&A obligations explains why group finance costs fell from ₹109 crore in FY25 to ₹90 crore in FY26 even as network operations expanded.1 The reduction reflects the roll-off of historical acquisition debt rather than lower borrowing rates, creating a quantifiable, temporary tailwind for earnings.
The doctor retention question — and a widely repeated number that needs correcting.
The central operational risk of acquiring single-surgeon practices is clinician departure once earnout periods expire. Post-IPO commentary frequently cited a 12.5% clinical attrition rate for FY24. However, company filings clarify that the 12.52% figure in the offer document measured total employee turnover across 2,772 staff members, down from 12.73% in FY23 and 25.49% in FY22, rather than doctor departures specifically.5
Management provided detailed clinical turnover data during an August 2026 analyst call. Group-level doctor attrition ran between 16% and 17%, driven primarily by junior physicians, DNB candidates, and rotating fellowship trainees. By contrast, senior doctor attrition remained low at 2% to 3%, with Chief Executive Officer Adil Agarwal stating that senior clinicians rarely leave the organization.2 Paramedical turnover among optometrists and technicians ranged from 21% to 25%, accompanied by annual wage increases of 9.5% to 10%.3
To manage paramedical turnover without inflating labor costs, the company relies on an internal educational pipeline, running optometry schools that offer three-year degree programs plus a one-year internship. On the FY26 earnings call, management cited this in-house training infrastructure as a solution to industry-wide shortages of trained optometrists.3
While self-reported turnover metrics are not independently audited, regional operational performance offers empirical context: revenue in the western region grew 24.3% year-on-year in the June 2026 quarter, while northern region revenue rose 50.4%.1 These expansion rates indicate that post-earnout clinician attrition has not disrupted growth in acquired territories.
And then they stopped buying.
The defining M&A development for the company in 2026 is that it largely halted acquisitions. Organic additions represented 33.3% of total facility additions in FY22 and 32.2% in FY23, before rising to 64.4% in FY24 and 88.1% in FY25. By FY26 and the June 2026 quarter, 100% of new facility additions were organic greenfield builds.1 Asked on the FY26 call whether all sixty planned FY27 facilities would be built organically, Adil Agarwal confirmed they would be, adding that while management remained open to acquisitions at the right price, no M&A deals were in the active pipeline.3
Management attributes this pivot to internal execution capabilities, pointing to 166 greenfield facilities opened since FY23 — a 5.7-fold increase in annual expansion velocity — supported by a standardized playbook for site selection, facility fit-out, clinical staffing, and regional market entry.2 However, market dynamics suggest valuation pressure also played a role. Private equity entries, including a ₹1,500 crore investment by General Atlantic and Kedaara into ASG Eye Hospital in 2022 and ChrysCapital's backing of Centre for Sight, drove up purchase multiples for established regional clinics.14 Greenfield development costs are predictable, whereas acquisitions require outbidding competing financial sponsors.
Choosing to build rather than buy in a competitive market reflects capital discipline, prioritizing long-term return on invested capital over short-term revenue expansion. However, this strategy shifts operational risk: greenfield facilities incur upfront gestation losses before reaching profitability, setting up the financial trade-offs examined in the next section.
V. Business Model & Economic Anatomy: Surgeries, Optical, & Lease Accounting
Here is the sentence that explains this company's income statement better than any other: in FY26, Dr. Agarwal's earned an EBITDA margin of 28.9% and a net margin of 7.9%.1 Everything interesting about the economics lives in the gap between those two numbers.
Start with where the revenue comes from.
In the June 2026 quarter, surgeries generated 65.9% of revenue, optical products, contact lenses and accessories 13.6%, diagnosis and consultations 12.0%, and eye-care pharmaceuticals 8.5%.1 Combine the two retail lines and you get about 22% of revenue from selling things — glasses, lenses and drops — to a patient who is already in the building because their vision is failing.2 That is a structurally advantaged retail position: zero customer acquisition cost, a prescription written moments earlier by a clinician the customer trusts, and no need to compete on price against an online store the patient has not yet thought to check.
The surgical mix is dominated by one procedure. Cataract accounted for approximately 74% of the 91,082 surgeries performed in the June 2026 quarter; refractive procedures — LASIK, SMILE — were about 4.4%.2 Cataract volumes grew 16.5% year on year; everything else grew 13.3% on a blended basis.2
The pricing engine, decoded.
Revenue grew 26% while surgical volumes grew 15.5%. Where did the other eleven points come from? Management's answer, given by COO Rahul Agarwal, was unusually precise: on a like-for-like basis, roughly 7.5% came from premiumisation and about 0.5% from price increases.2
That distinction matters enormously. This business is not raising prices. It is changing what it sells.
The average realisation on a cataract has moved from roughly ₹28,000–30,000 four years ago to about ₹42,000 today.2 The driver is patient choice of lens and technique. A standard monofocal lens corrects distance vision; the patient still needs reading glasses. A premium lens corrects multiple distances. And femto cataract surgery — what the company markets as robotic cataract surgery — uses a femtosecond laser to make the incisions and soften the lens, rather than a blade and ultrasound alone.
The unit economics of that upgrade are disclosed and instructive. The additional charge to the patient for a femto procedure is around ₹35,000; the "click fee" the company pays the equipment licensor per procedure is roughly ₹10,500–11,000.2 So a femto case adds roughly ₹24,000 of gross profit. Femto procedures reached 1,548 in the June 2026 quarter, up 33.4%, and high-end cataracts were 29.3% of all cataracts — up from 26.3% for FY26 as a whole and 22.5% in FY25.23
Read that as a mix migration with a long runway, driven by two forces largely outside the company's control: rising insurance penetration and rising disposable income. Payor mix in the June 2026 quarter was 63.6% cash, 27.7% insurance and TPA, and 8.7% government schemes.1 As insurance takes more of the bill, the patient's willingness to upgrade the lens rises, because the incremental out-of-pocket cost of a better outcome shrinks relative to the base procedure.
Management, to its credit, does not oversell the durability. Asked whether 10% annual realisation growth could persist, Adil Agarwal declined to commit to a number and instead answered directionally: the shift will continue as insurance grows and technology percolates, but "it's difficult to answer whether same 10% will be there or 8%."2 That is a more honest answer than the question invited.
Same-store growth: the number that actually tests the model.
For facilities opened or acquired up to FY23, revenue in the June 2026 quarter was ₹465 crore, growing 16.3% year on year — and those facilities still represent 75.9% of group revenue.1 The FY24 cohort grew 19.6%, the FY25 cohort 38.6%.1
Decomposed, the mature-cohort growth splits roughly evenly: about 8% volume, about 8% value. Within the volume half, roughly 6 points come from more people walking in the door and about 2 points from better conversion of those walk-ins into surgeries.2
This is the single most important disclosure in the pack, and it deserves plain language. A three-year-old eye hospital in Chennai is seeing meaningfully more patients this year than last, converting slightly more of them into surgery, and selling each of them a somewhat more expensive procedure. That is what a healthy specialty network looks like. It is not what a network that has saturated its market looks like. And management has explicitly framed low-to-mid teens as the realistic long-run rate: Adil Agarwal called 12–13% "phenomenal" and treated the 16.3% as an outperformance to be appreciated rather than extrapolated.2 That is guidance discipline, and it is the kind of behaviour worth tracking over several years before crediting.
Now the gap between EBITDA and profit.
The company reports two EBITDA figures, and the difference between them is the whole lease-accounting argument. Under Ind AS, a lease is capitalised: the right to use the premises becomes an asset, the obligation to pay rent becomes a liability, and rent disappears from operating costs, reappearing as depreciation and interest below the EBITDA line. Under the older Indian GAAP presentation, rent is simply an operating expense.
For FY26: Ind AS EBITDA of ₹614 crore, IGAAP EBITDA of ₹453 crore.1 The ₹161 crore difference is cash rent — about 7.7% of revenue. The reported margin under Ind AS was 28.9%; on the cash-rent basis it was 22.5%.1
Neither number is wrong. But an investor comparing this company's 28.9% margin to a hospital group that owns its real estate is comparing a leaseholder's operating margin to a freeholder's, and the leaseholder looks better than it is. The honest comparison uses the IGAAP figure, or capitalises the lease liability into enterprise value.
Below EBITDA, FY26 carried ₹276 crore of depreciation and amortisation (13.3% of revenue) and ₹90 crore of finance cost (4.3%).1 Together, 17.6% of revenue evaporates between operating profit and pre-tax profit — a heavier burden than an asset-owning hospital chain carries, and the mechanical reason net margin sits in single digits.
But the "permanent compression" thesis is being falsified in real time. Net margin has gone from 6.4% in FY25 to 7.9% in FY26 to 8.9% in the June 2026 quarter.1 Three forces are doing it: the acquisition-interest roll-off described earlier; ₹195 crore of borrowings repaid using IPO proceeds — ₹128 crore in Q4 FY25 and ₹67 crore in H1 FY26; and operating leverage as mature facilities absorb more volume without more rent.3 The group carried net cash of ₹62 crore at June 2026 on gross debt of ₹152 crore.1 Lease liabilities remain the real leverage; conventional borrowing is now immaterial.
What a new centre actually costs — and loses.
The FY27 plan is 60 facilities — 40 surgical, 20 clinics — at total capex of ₹380–400 crore including a new Chennai flagship.3 That is a blended figure across very different assets: a primary clinic is cheap, a tertiary hospital is not.
And new centres lose money. Management quantified it without prompting: greenfield losses were about ₹21 crore for the FY25 cohort, about ₹30 crore for the FY26 cohort, and roughly ₹20 crore at corporate EBITDA level in the June 2026 quarter alone across the FY26 and FY27 cohorts including pre-operating losses.32 Asked whether FY27 would carry a similar or larger fresh drag, COO Rahul Agarwal agreed directionally that it would, given a higher count of surgical openings.3
Management says three years is the transition from emerging to mature.2 The vintage data broadly supports it: emerging facilities were 21% of revenue in the June quarter across 158 units, against 146 mature units generating 79%.1 The mature units are, in other words, roughly 3.5x more productive per site.
The investment implication is uncomfortable but clear. Every year the company accelerates openings, it books a fresh loss cohort that suppresses reported margin, in exchange for a mature cohort three years later. Consolidated margins have expanded anyway. That is the operating leverage argument working — but it is a treadmill, and it only works while same-store growth in the mature base stays healthy.
Which raises the question the market spent most of 2025 arguing about: what is all of this worth, and who was selling it?
VI. The Capital Structure & IPO Story (2024–2025)
For most of the past decade, an Indian investor seeking market exposure to Dr. Agarwal's could already trade its shares. Dr. Agarwal's Eye Hospital Limited had been listed on the BSE for years under scrip code 526783 — a small, profitable company operating the group's legacy Tamil Nadu units.16 It served as the family's original listed vehicle, sitting as a publicly traded subsidiary beneath a much larger unlisted parent.
When the parent company came to market in January 2025, it asked public investors to buy a holding entity whose most visible operating asset was already publicly traded at a materially lower valuation multiple — a structure naturally calculated to invite market skepticism.
The offer.
The book opened on January 29, 2025, and closed on January 31 at a price band of ₹382 to ₹402 per share.7 Of the ₹3,027.26 crore raised, only ₹300 crore represented primary capital for debt repayment, general corporate purposes, and unidentified acquisitions (with inorganic growth spending capped at 25% of gross proceeds), while the remaining ₹2,727 crore went to selling shareholders.58
Value Research, analyzing the figures at the upper end of the valuation band, priced the issue at 123.3 times earnings and 7.0 times book value, compared to a peer median of roughly 70 times, while noting an operating earnings yield of about 2% — far below its 8% benchmark for investment quality.6 The firm also highlighted concentration risk, with nearly half of the group's facilities clustered in Tamil Nadu and Maharashtra, alongside competitive pressure from ASG and Centre for Sight that limited pricing power.6 Over the preceding three years, average return on equity reached 18% and return on capital employed stood at 11%, even as revenue compounded at 38% and net profit expanded 48% annually.6 The company's top-line momentum was clear; its valuation was the point of debate.
Domestic and international brokerages arrived at widely divergent multiples depending on their choice of underlying earnings base. One brokerage calculated a forward multiple of 79 times earnings and rated the issue neutral on valuation grounds, while another declared it fairly valued on an enterprise value-to-EBITDA basis. That wide analytical spread signaled the core issue: when analysts examining the same public disclosures land anywhere between 79 and 160 times earnings, the valuation relies on annualizing a small, fast-growing denominator, turning the multiple into a reflection of growth assumptions rather than current earnings power.
The market's verdict was tepid, and selective.
The issue was subscribed 1.55 times overall. Qualified institutional buyers bid 4.64 times their allocation, but retail investors covered only 0.41 times their quota and non-institutional investors bid 0.40 times.8 The grey market premium on the eve of listing stood at ₹0.50 — a negligible buffer.8
Institutional managers took up shares while broader retail interest lagged. The stock listed on the NSE at ₹402 — matching the issue price — and on the BSE at ₹396.90, reflecting a 1.27% discount. One month later, following the expiration of the 30-day anchor investor lock-in period, the shares declined roughly 5%.
Was the market's hesitation driven by price or corporate structure? Both factors played a role, though the corporate structure created unnecessary headwinds. The parent entity held all non-Tamil Nadu Indian facilities, international operations in Africa, the optical distribution division, and device subsidiary Elisar Life Sciences, while the listed subsidiary controlled only the legacy Tamil Nadu centers.5 Public shareholders in the subsidiary held claims on cash flows that parent-level investors were simultaneously paying to acquire — creating a classic holding-company discount that weighed on the parent's initial valuation.
Management responded by simplifying the structure.
On August 27, 2025, the boards of both companies approved a scheme of amalgamation to merge the listed subsidiary into the parent. Under the terms of the deal, subsidiary shareholders receive 23 new parent shares of ₹1 face value for every 2 subsidiary shares of ₹10 face value — a swap ratio set at a 15% premium to the subsidiary's ten-day volume-weighted average price.10 Chief Executive Officer Adil Agarwal framed the transaction as a strategic step to streamline group operations and unlock combined value under a single corporate structure, with management projecting the merger would be earnings accretive in its first year.10
The subsequent regulatory timeline illustrates the pace of corporate restructuring in India. Stock exchange observation letters were issued with no adverse objections in February 2026, clearing the path for an NCLT filing. In May 2026, the Chennai bench of the NCLT approved the joint first motion and directed the companies to convene shareholder and creditor meetings on July 2, 2026.3 At those meetings, parent shareholders approved the scheme with 99.95% voting in favor, while the subsidiary's unsecured creditors backed the proposal unanimously. During an August 2026 analyst call, Adil Agarwal noted that management expected final closure around mid-November 2026 — completing a fifteen-month journey from board approval to final implementation.2
That simplification required direct cash outlays, including approximately ₹80 lakh in one-off merger costs at the subsidiary level in the fourth quarter of FY26 for legal counsel, financial fairness opinions, and shareholder outreach services — expenses that management explicitly highlighted as non-recurring when addressing an uptick in overhead.3
The economic significance of the subsidiary has also shifted. At the time of the IPO, commentary frequently described the subsidiary as generating roughly 70% of total group earnings. Financial disclosures show that proportion has receded: in FY26, the subsidiary generated ₹70 crore in profit after tax out of group net profit of ₹168 crore, or approximately 42%.1 During the June 2026 quarter, the subsidiary contributed ₹23 crore of the group's ₹55 crore net profit, maintaining that 42% share.1 Meanwhile, the share of group profit attributable to parent equity holders increased from 75.6% in FY25 to 79.2% in FY26,3 reaching 82.2% in the June 2026 quarter.2 The parent network has outgrown its legacy subsidiary, making the merger a formal alignment with existing economic realities.
Sponsor overhang is being absorbed through public market transactions.
On August 12, 2026, eight days after the company reported strong quarterly earnings, TPG's Hyperion vehicle and Temasek's Claymore entity executed block sales totaling 12.63% of the company's equity — comprising 2.41% and 5.01% respectively, for total proceeds of ₹2,007.9 crore — at trade prices of ₹501.03 and ₹501.54 per share.9 Following the transaction, Hyperion's stake decreased from 23.09% to 15.47%, while Claymore's holding fell from 10.19% to 5.17%, though Temasek maintains additional ownership through its Arvon vehicle.9
Institutional buyers absorbed the block placement cleanly. ICICI Prudential Mutual Fund acquired ₹311 crore of stock, Polar Capital purchased ₹182 crore, Invesco took ₹180 crore, and Allianz Global Investors acquired ₹89 crore — transferring nearly 4.8% of total outstanding equity to long-only institutional asset managers.9 The execution price of ₹501 per share compared favorably against TPG's average cost basis of ₹274 and the original IPO price of ₹402.
Market participants view these secondary placements through two distinct lenses. The optimistic interpretation emphasizes that private equity overhang is being steadily converted into long-term institutional ownership at expanding valuations. The cautious view notes that financial sponsors have monetized positions twice into share price strength and retain substantial residual stakes for future distribution. Both perspectives reflect market realities, though the market's ability to absorb a ₹2,000 crore block trade without downward price pressure demonstrates institutional demand for the platform.
That secondary market liquidity sets up the broader industry backdrop and competitive landscape for the business.
VII. Industry Structure & Competitive Dynamics
To understand why institutional capital continues to flow into Indian eye care, consider the stark imbalance in healthcare supply: India has roughly 1.5 ophthalmologists per 100,000 people, compared to an estimated requirement of 8.7 eye care professionals per 100,000.1 The fundamental constraint in the market is not patient demand, but the availability of organized clinical supply.
Market sizing data from Crisil Intelligence establishes the overall backdrop. India's broader healthcare delivery market reaches roughly ₹7.7 lakh crore and is growing at 10% to 12% annually through FY30. Single-specialty care accounts for ₹2.7 lakh crore to ₹3.5 lakh crore of that total. Within single-specialty delivery, eye care represents approximately ₹48,500 crore and is forecast to compound at 12% to 14% annually through FY30 — making it the country's fastest-growing specialty across both historical and projected periods, outstripping dentistry, maternity, oncology, and orthopedics.1
But the number that matters most is the organised share.
The organized eye care market — comprising corporate chains rather than single-doctor clinics or charitable trusts — expanded from roughly ₹2,200 crore in FY20 to about ₹7,030 crore in FY26, and is projected to reach ₹13,800 crore by FY30.1 That growth trajectory represents a historical compound annual rate of 21.3% and a projected forward rate of 18.4%.
Against the ₹48,500 crore total market, organized chains control roughly 14% to 16% today, with projections reaching 16% to 19% by FY30.1 Five out of every six rupees spent on eye care in India still flows to standalone clinics, trust hospitals, or public institutions.
That structural gap underpins the growth thesis. Corporate chains capture share from standalone practices through distinct operational advantages: a chain can amortize advanced diagnostic equipment like OCT scanners and femtosecond lasers across high patient volumes; offer multi-specialty sub-disciplines from cornea to retina under one roof; process insurance and third-party administrator claims through centralized back offices; and maintain digital discovery channels. A standalone clinic relies primarily on the founding doctor's local reputation — an asset that rarely survives the physician's retirement.
Dr. Agarwal's commands roughly 26% to 27% of the organized chain segment according to Crisil data, which translates to about 4% of the overall Indian eye care market.1 These figures reflect two sides of the same commercial position: market leadership within the organized niche alongside a vast addressable market that remains unorganized.
The named competition.
Based on revenue for the fiscal year ended March 31, 2025, Crisil benchmarks Dr. Agarwal's in first place at ₹1,711 crore, followed by the second-largest chain at ₹1,113 crore and the third at ₹573 crore, while fourth- through seventh-ranked operators generate between ₹134 crore and ₹402 crore.1 By surgical facility count, Dr. Agarwal's leads with 199 locations, compared to 168 for its closest rival and 83 for the third-largest operator.1
The runner-up is ASG Eye Hospitals, its most direct national competitor. Backed by General Atlantic and Kedaara Capital following a ₹1,500 crore investment in July 2022 — then the largest private equity raise in Indian eye care — ASG operated over 50 hospitals across 16 states, Uganda, and Nepal at the time of the deal, having tripled revenue over the preceding three years.14 ASG has since expanded aggressively, acquiring Vasan Eye Care out of insolvency proceedings and preparing for an initial public offering.
A potential ASG listing carries significant capital market implications. It would establish a direct public peer for valuation comparisons while providing a well-capitalized competitor with listed equity currency for acquisitions — just as Dr. Agarwal's pivots toward organic greenfield development. Head-to-head competition between two listed national platforms for regional practices, surgical talent, and institutional capital would alter asset pricing across expansion markets.
The remainder of the competitive landscape remains largely regional. Centre for Sight, backed by ChrysCapital, maintains a strong premium position across Delhi-NCR and northern India, overlapping with Dr. Agarwal's primary expansion corridor. Eye-Q targets Tier-2 and Tier-3 northern markets at lower price points, while MaxiVision and regional peers hold established positions across Andhra Pradesh and Telangana. Meanwhile, Vasan Eye Care serves as the sector's primary cautionary tale, having expanded beyond its financial capacity before entering insolvency.
How Dr. Agarwal's actually competes, and where it does not.
The group's operational advantages center on procurement scale for intraocular lenses, surgical consumables, and capital equipment; a seven-decade brand legacy that drives complex tertiary referrals; and a captive retail optics business that enhances revenue per patient.
The primary operational vulnerability remains geographic concentration. Southern facilities generated ₹387 crore — 63.1% of domestic revenue — in the June 2026 quarter, compared to ₹91 crore from the west, ₹57 crore from the north, and ₹16 crore from the east.1 Dr. Agarwal's operates as a national platform reliant on a regional profit engine. In Delhi-NCR, where the network established a presence in late May 2025 and operates eight facilities, the company remains a challenger rather than an incumbent.32 Management explicitly acknowledged this dynamic on an analyst call, with Chief Executive Officer Adil Agarwal stating that surgical volume per center in Delhi had "not at all" reached southern levels, adding that "it's a long way for us in Delhi to become a mature facility."2
This highlights the central competitive tension facing the firm: market leadership in core historical territories alongside unproven economics in expansion geographies. The key question for investors is whether the operational playbook that produced southern dominance can be replicated nationally, or whether those competitive advantages remain inherently regional.
VIII. Strategy & Moats: 7 Powers & 5 Forces Analysis
A moat question is fundamentally a falsification question: what empirical evidence would have to emerge to disprove a claimed competitive advantage? Applied to Dr. Agarwal's, standard strategic frameworks sort the firm's positioning into advantages that are demonstrable, those that are plausible, and claims that remain largely unproven.
Hamilton Helmer's 7 Powers.
Scale economies — demonstrable, but narrower than claimed. The company purchases intraocular lenses, phacoemulsification consumables, and diagnostic equipment across 304 facilities. Observable evidence appears in gross margin: cost of goods sold declined from 21.9% of total income in the June 2025 quarter to 21.0% a year later, a roughly one-percentage-point improvement that management attributed partly to procurement scale and partly to surgical mix.12 While genuine and worth about a point of margin, scale economies in eye care plateau early; a competitor operating 168 surgical facilities buys at comparable pricing power.
Branding — strong regionally, under test in expansion markets. Nearly seven decades of history and an eye-shaped landmark in Chennai generate genuine pricing power and referral pull in Tamil Nadu. The falsification test is whether new-market centers ramp faster than a generic entrant's would. The 38.6% year-on-year growth in the FY25 facility cohort suggests the brand name carries weight in new territories.1 Conversely, approximately ₹30 crore in greenfield losses concentrated in the FY26 cohort — including entry into Delhi — indicates that brand awareness alone does not eliminate market entry costs.3
Process power — the strongest of the seven powers. Process power represents the ability to run a standardized, high-throughput surgical operation across 165 cities without degrading clinical quality. The company executes this through a clinical board of senior physicians overseeing network-wide protocols so outcomes match across locations; captive optometry schools producing trained paramedics; postgraduate training programs across four sites; and Neo, a proprietary hospital management system handling roughly 20,000 patients daily and designed to scale beyond the current footprint.3 The company also maintains the highest number of NABH-accredited facilities among Indian eye care chains.1 Process power is difficult to acquire and takes years to construct, making it a true competitive advantage.
Counter-positioning — moderate and structural. A dedicated eye care chain presents a structural challenge to a multi-specialty hospital's ophthalmology department, offering specialized equipment, faster turnaround, and lower overhead per procedure. Incumbent general hospitals cannot easily retaliate without stranding their fixed cost base. While this provides a clear advantage against general hospitals, it offers no differentiation against competing specialized eye care chains.
Cornered resource — weak, and constrained by talent supply. The critical scarce input in eye care is qualified surgical talent. Although senior doctor attrition remains low at 2% to 3%, the company holds no exclusive structural lock on physicians, operating in an environment where well-capitalized rivals actively compete for talent.2 Training clinicians through internal programs provides a practical talent pipeline, but does not constitute a cornered resource.
Network economies and switching costs — largely absent. Patients receiving cataract surgery do not experience structural switching costs or network lock-in. Repeat volume relies on second-eye procedures, ongoing follow-up care, and retail optical purchases — driven by patient trust rather than high switching costs. Network effects are fundamentally absent in this single-specialty clinical model.
Porter's Five Forces.
Threat of new entrants — bifurcated by facility tier. Opening a primary vision center requires modest capital, presenting low barriers to entry. Conversely, establishing a tertiary vitreo-retinal hospital demands significant equipment investment and specialized surgical expertise. Consequently, the company's competitive position is well-protected at the tertiary level, while primary centers function primarily as customer-acquisition channels rather than standalone profit drivers.
Buyer power — low overall, but expanding through institutional payors. Individual patients facing vision loss rely heavily on clinical recommendations rather than price comparisons. However, insurance providers and third-party administrators now represent 27.7% of total revenue.1 As institutional payors aggregate volume, their bargaining power over reimbursement rates exceeds that of individual patients. Management is actively navigating this dynamic; on the FY26 earnings call, Chief Operating Officer Rahul Agarwal noted that the company was discussing coverage support with insurers for refractive procedures that remain largely out-of-pocket.3
Supplier power — moderate to high, and rising with technology adoption. Advanced surgical lasers and premium intraocular lenses are supplied by a concentrated group of global manufacturers. The per-procedure "click fee" of approximately ₹10,500 to ₹11,000 paid for femtosecond laser technology illustrates suppliers extracting direct usage revenue on high-end procedures.2 As premium procedure adoption increases, aggregate supplier payments grow accordingly. Although gross margins per procedure remain positive, pricing power over core technology fees rests primarily with equipment manufacturers.
Threat of substitutes — negligible. No non-surgical alternative exists for cataract lens replacement. Demand remains structurally tied to demographic aging, leaving the core procedure insulated from technological substitution.
Rivalry — intense and accelerating. Competition among private-equity-backed chains for clinical talent, real estate, and public market capital remains elevated. To date, rivalry has not triggered price erosion — average realization per procedure continues to rise — indicating that overall market demand is currently expanding faster than organized network capacity.
The synthesis. The platform's defensible core rests on process power, regional brand equity, and clinical referral networks. However, competitive frameworks demonstrate that scale in eye care is not inherently self-reinforcing like a digital network or platform marketplace. Operating returns must be earned facility by facility and patient by patient across the entire network.
IX. Current Management, Governance, & Activist Stress Test
During an August 2026 earnings call, an analyst asked about doctor turnover. Chief Executive Officer Adil Agarwal disaggregated the group attrition metric into junior and senior tiers, providing specific figures for both, while noting that the firm had added 100 physicians over four months whose full productivity would take time to materialize.2 For public market investors, detailed responses during unscripted analyst Q&A offer useful visibility into operational management.
Who runs it.
The executive architecture combines a family of eye surgeons in leadership positions with a board featuring private equity representation.
Dr. Amar Agarwal, Executive Chairman. The clinical pioneer authored more than 50 textbooks and over 250 journal articles, delivered more than 850 conference presentations, and participated in over 5,500 charitable eye camps.12 His primary role within the corporate platform centers on clinical credibility and innovation, with pinhole pupilloplasty (PPP) branded as his development and highlighted in company presentations.1
Dr. Adil Agarwal, CEO. The third-generation executive who spearheaded the group's institutionalization manages capital markets communication and sets operational guidance. At the start of FY27, management announced plans for 60 new facilities — 40 surgical centers and 20 vision clinics — split evenly between fiscal halves.3 After delivering 18 additions, including 16 surgical centers, in the first quarter, the company adjusted its near-term timeline to 12 openings in the second quarter and 30 in the second half, citing a pipeline of over 30 signed letters of intent to reaffirm the full-year target.2
Dr. Ashar Agarwal, Chief Business Officer; Mr. Rahul Agarwal, COO; Dr. Vandana Jain, Chief Strategy Officer; Mr. Yashwanth Venkat, CFO.32 Operational unit economics and balance-sheet questions on quarterly calls are handled primarily by the Chief Operating Officer and Chief Financial Officer.
The board of directors includes independent members with executive backgrounds at Infosys, the Bill & Melinda Gates Foundation, and Dr. Reddy's Laboratories, alongside TPG partner Ankur Nand Thadani as a non-executive director.1
The activist stress test.
Evaluating the group through a critical governance lens highlights six primary structural and operational considerations.
Challenge one: holding company structure. The listed subsidiary structure presented an operational discount at the IPO. Management moved to resolve the complexity by announcing a scheme of amalgamation seven months after listing.10 Final execution remains targeted for mid-November 2026.
Challenge two: promoter alignment. As of June 30, 2026, the promoter group retained a 32.3% stake, compared to TPG's 23.1% and Temasek's 20.1% prior to the August 2026 block trade.1 However, promoter family members — including Dr. Amar Agarwal, Dr. Athiya Agarwal, Dr. Adil Agarwal, Dr. Anosh Agarwal, Dr. Ashvin Agarwal, and Dr. Ashar Agarwal — were selling shareholders in the IPO alongside financial sponsors.5 With weighted average cost bases ranging between ₹118 and ₹148 per share against the ₹402 IPO price, promoters monetized equity value while maintaining operational management.5
Challenge three: executive compensation. In FY24, the pre-IPO fiscal year disclosed in prospectus filings, Dr. Adil Agarwal received ₹4.53 crore in short-term compensation plus ₹0.33 crore in perquisites, Dr. Anosh Agarwal received ₹4.51 crore plus ₹0.41 crore, Dr. Amar Agarwal received ₹2.36 crore, Dr. Ashar Agarwal received ₹1.90 crore, Dr. Athiya Agarwal received ₹0.92 crore, and Dr. Ashvin Agarwal received ₹1.01 crore in consultancy fees.5 Aggregate promoter compensation approached ₹15 crore against group net profit below ₹100 crore. While reflective of active medical and management roles, the compensation-to-profit ratio warrants ongoing monitoring as earnings scale.
Challenge four: debt guarantees. Prior to listing, promoters provided personal guarantees on term debt, and the parent company issued corporate guarantees totaling ₹64.98 crore for Axis Bank credit extended to the listed subsidiary, ₹10.22 crore to HDFC Bank for Aditya Jyot, and ₹1.75 crore to SBM Bank for the Mauritius division, with 1.35 million subsidiary shares pledged as collateral.5 The pending merger and ongoing debt reduction aim to eliminate these legacy encumbrances once final regulatory approvals are completed.
Challenge five: portfolio complexity. Ophthalmic device subsidiary Elisar Life Sciences is excluded from core operating disclosures — including payor mix, mature-versus-emerging revenue splits, and center vintage analysis — due to its non-clinical focus.1 The unit generated 0.25% of total revenue in FY24.5 While small in scale, the entity represents a non-core operations line within a single-specialty platform.
Challenge six: return on capital. The company's three-year average return on capital employed stood at 11% at the time of the IPO.6 For a business generating an Ind AS EBITDA margin of 28.9%, the gap reflects capitalization of lease liabilities and goodwill from past M&A. While management discloses greenfield losses by annual cohort, cash-on-cash returns per mature center are not separately reported in quarterly filings.
Narrative consistency. Across FY26 and FY27 disclosures, company guidance has maintained consistent parameters: a 60-facility annual expansion target, stable operating margin expectations during aggressive growth, a three-year center maturation curve, and a consistent merger execution window.32 Operational adjustments are disclosed as they occur; for instance, the opening of the Chennai flagship facility moved from the second quarter to October 2026 due to administrative delays during election code-of-conduct periods, with management noting that legacy and new facilities would operate in parallel until operational consolidation could be evaluated.3
X. Strategic Risk Radar & The 3 Vital KPIs
A risk radar is useful only if it identifies specific financial transmission mechanisms rather than generic categories. For Dr. Agarwal's, four operational risks carry a direct, traceable path to future earnings.
1. The greenfield treadmill. This represents the central operational risk facing the company's organic expansion strategy. Each new facility cohort incurs gestation losses that scale directly with surgical capacity — recording ₹21 crore in losses for the FY25 cohort, ₹30 crore for FY26, and roughly ₹20 crore in the June 2026 quarter alone across combined FY26 and FY27 cohorts.32 Management has acknowledged that the full-year FY27 drag will be at least as large.3 The model generates strong overall returns as long as mature-facility revenue grows in the mid-teens while new locations reach profitability within roughly three years. However, the thesis weakens if mature-store growth slows to single digits, or if entry into new markets requires four to five years to reach maturity. The Delhi-NCR cluster serves as the primary live test case, where Chief Executive Officer Adil Agarwal noted that center productivity remains a long way from southern levels.2
2. Technology capex escalation. Premium procedure migration — including femtosecond lasers, SMILE platforms, vitrectomy systems, and advanced diagnostics — generates roughly half of mature-store revenue growth. These technologies carry high upfront equipment costs, ongoing per-procedure licensing fees, and rapid obsolescence cycles. Company disclosures list the need to upgrade technology in line with evolving industry trends, which may lead to higher capex, as a structural feature of the sector.1 With FY27 capex budgeted at ₹380 crore to ₹400 crore — roughly 18% of FY26 revenue — any acceleration in technology turnover before legacy equipment is fully amortized would increase a depreciation burden that already consumes 13% of total revenue.3
3. Payor mix shift and reimbursement pressure. Cash pay rose from 61.7% to 63.6% between the June 2025 and June 2026 quarters, yet the multi-year trajectory moves toward third-party coverage.1 Private insurers and government health schemes negotiate procedural reimbursements aggressively. Premium intraocular lens upgrades currently represent discretionary out-of-pocket decisions by individual patients; if payors mandate strict formulary caps, procedural pricing power will narrow. Simultaneously, management is actively seeking insurance coverage for refractive procedures, a shift that could expand patient volume while exposing pricing terms to institutional negotiation.3
4. Geographic concentration and regional volatility. Southern markets generate 63.1% of domestic revenue, leaving consolidated financial performance sensitive to regulatory changes, clinical incidents, or competitive shifts in Tamil Nadu.1 Operational results also demonstrate sensitivity to localized disruptions: management attributed muted growth in Punjab and Jammu & Kashmir during the June 2025 quarter to Operation Sindoor and regional flooding, creating a lower comparison base that elevated northern revenue growth to 50.4% in the June 2026 quarter.2
Two frequently cited risks warrant perspective. Foreign exchange and import cost risks are real given that specialized medical equipment is priced in US dollars or euros, but surgical consumables flow through a cost of goods sold line that represents 21% of revenue and has steadily improved as scale expanded. Similarly, potential government price caps on cataract surgeries or intraocular lenses represent a structural tail risk given historical precedents in stents and knee implants, though no specific regulatory proposals are pending.
The three KPIs that actually matter.
One: same-store sales growth in the mature cohort, split into volume and value. This metric serves as the definitive test of network health. For facilities established or acquired through FY23, revenue grew 16.3% in the June 2026 quarter, split evenly between an 8% volume increase and an 8% value expansion, with walk-in patient growth accounting for roughly 6 percentage points of the volume gain.12 Evaluating all three layers is critical: headline growth sustained primarily through price increases alongside stagnant walk-in volume would signal market saturation. Management's long-term target of 12% to 13% same-store growth provides the baseline for evaluating execution.2
Two: greenfield loss per cohort against facility additions. Tracked across annual and quarterly reporting periods, this metric indicates whether brand equity lowers market entry costs in expansion territories. While aggregate cohort losses have expanded alongside accelerated openings, tracking loss per new surgical facility determines whether greenfield expansion remains economically efficient or degenerates into capital-inefficient growth across unfamiliar markets.
Three: high-end procedure penetration. High-end cataract surgeries expanded from 22.5% of total cataract volume in FY25 to 26.3% in FY26, reaching 29.3% in the June 2026 quarter.23 Premium procedure adoption directly drives realization growth and supports half of same-store expansion. Because premium upgrades depend on consumer discretionary spending and insurance reimbursement rules, any slowdown in adoption would constrain top-line expansion toward base volume growth.
Conversely, headline facility counts function as expansion inputs rather than indicators of value creation, while consolidated EBITDA margins remain distorted by lease accounting conventions and network vintage mix. Tracking mature same-store dynamics, greenfield unit losses, and premium procedure adoption provides the clearest empirical measure of platform performance.
XI. Bear vs. Bull Case Analysis
Two coherent, evidence-based cases emerge from the same disclosures, and both demand equal scrutiny from investors.
The bull case: a formalisation trade with a working operating model.
The core bull thesis rests on industry structure. Roughly five out of every six rupees spent on Indian eye care still flow to unorganized clinics and charitable trusts, allowing the organized segment to compound at an estimated 18% annually through FY30 while the overall market expands by 12% to 14%.1 Network expansion and industry formalization compound together. Growth does not require winning market share directly from national peers like ASG or Centre for Sight; rather, it relies on capturing volume from retiring solo practitioners by establishing nearby locations.
Second, operational execution displays multi-layered strength. Mature-facility same-store revenue grew 16.3%, split almost evenly between higher patient traffic and an improved procedural mix.12 Overall revenue expanded 26% against a 15.5% increase in surgical volumes.2 Meanwhile, operating EBITDA margin widened by 30 basis points despite absorbing a new cohort of loss-making centers, and net margin expanded 127 basis points.1 Maintaining margin expansion alongside the fastest network opening pace in company history demonstrates genuine operating leverage rather than unbacked top-line expansion.
Third, underlying earnings quality is improving through structural operational shifts rather than accounting adjustments. Debt service costs are falling as legacy M&A earnout liabilities roll off, complemented by debt repayments funded from IPO proceeds. Operating cash flow reached approximately 84% of EBITDA in FY26,3 leaving the company with a net cash balance.1 Simultaneously, gross margin expanded by roughly one percentage point, driven by procurement efficiencies and favorable surgical mix.2
Fourth, corporate structural complexity is nearing resolution. The holding-company discount that weighed on valuation at listing is being removed through a merger approved by shareholders and creditors, leaving final NCLT sanction as the remaining formal step.2
Fifth, long-term optionality remains unpriced in most market models. International operations across nine African countries generate 10.1% of revenue; the pinhole pupilloplasty (PPP) surgical technique commands international clinical recognition; and the proprietary in-house Neo software platform is engineered to scale across a far larger network footprint.13 These initiatives require modest incremental capital while offering structural upside.
The bear case: paying a premium multiple for a business that must keep sprinting.
The bear counter-thesis begins with the continuous capital and execution demands of the business model. Lacking a structural moat that permits passive compounding, the platform must open roughly 60 new facilities annually — recruiting clinicians and building patient awareness in unfamiliar markets — while maintaining mid-teens growth across its mature base. Slowing expansion decelerates overall revenue growth, while accelerating openings generates recurring gestation losses that suppress reported net profit. The FY26 greenfield cohort generated ₹30 crore in operating losses, and management expects the FY27 drag to be comparable.3 Consequently, the business operates in a continuous trade-off between top-line expansion speed and near-term margin realization.
Second, geographic concentration persists despite new facility additions. Southern operations generate 63.1% of domestic revenue and grew 22.8% year-on-year,1 meaning the core regional base is expanding almost as fast as new territories are added. Northern centers account for just 9% of revenue and would require years of hyper-growth to alter group revenue balance, particularly given that the region's 50.4% headline growth rate was elevated by disruptions in the prior-year comparison base.2
Third, center-level return on capital remains unverified in public filings. A three-year average return on capital employed of 11% at the time of the IPO, set against a reported 28.9% Ind AS EBITDA margin, highlights substantial capital intensity and lease obligations below the operating line.61 Without granular disclosure of center-level payback periods, external investors cannot independently verify whether network expansion creates long-term economic value or merely accumulates top-line scale.
Fourth, valuation offers a narrow margin of safety. After listing flat at ₹402 per share in February 2025, the stock traded around ₹500 by August 2026 — roughly 25% above its issue price over eighteen months, trailing FY26 net profit growth of 52.4%.19 Although strong earnings growth has compressed the earnings multiple from the 123 times calculated by Value Research at the IPO,6 the valuation leaves little room for execution missteps, requiring sustained mid-twenties revenue expansion and continuous margin improvement.
Fifth, private equity sponsor overhang remains an active consideration. Following the August 2026 block trade, TPG retains a 15.47% equity stake while Temasek holds positions across two investment vehicles.91 Although institutional asset managers cleanly absorbed recent secondary placements at premium prices, residual private equity holdings create periodic market supply that can cap near-term share price appreciation.
Sixth, competitive intensity among organized operators is accelerating. ASG Eye Hospitals' potential public listing and explicit M&A focus present a strategic contrast to Dr. Agarwal's decision to pause acquisitions.14 If a rival uses public equity currency to consolidate regional practices, Dr. Agarwal's exclusive reliance on greenfield development will be tested on whether capital discipline outpaces lost market coverage.
Reconciling the two.
Applying the strategic frameworks from Section VIII yields a measured verdict. The company's durable advantages — process standardization, regional brand equity, and clinical referral networks — are operationally real and difficult to replicate, but remain regional and execution-dependent rather than structural moats. The platform functions not as an asset-light tollbooth, but as a disciplined operating engine in an underserved, fast-growing market, led by a management team with a track record of meeting public operational targets.
The investment thesis ultimately turns on three observable empirical tests. If mature-facility same-store growth remains in the low-to-mid teens driven by steady patient volume, if greenfield cohorts achieve profitability within three years, and if high-end procedural adoption continues to rise, the bull case is being validated quarter by quarter. Conversely, if mature same-store growth decelerates toward single digits or expansion cohorts in northern and western markets remain unprofitable beyond their third year, the bear thesis takes hold and the stock's valuation multiple faces downward adjustment.
All remaining developments — the corporate merger, private equity block sales, international operations, and clinical techniques — remain secondary to these core operational metrics.
XII. Epilogue & Investor Playbook
The history of Dr. Agarwal's presents a striking contrast. In 1957, two physicians founded a single practice in Madras and spent four decades conducting free eye camps across rural Tamil Nadu, building brand trust through community care. By 2026, their descendants lead a corporation that opened sixteen surgical centers in a single quarter, tracks payor mix down to the basis point, and conducts analyst calls where executive management decomposes top-line growth into volume, price, and procedural premiumization.2
The underlying clinical offering remains the restoration of sight, and patient choice continues to rely on clinical reputation and personal referrals. What has changed is the industrialization of that trust — codified into a clinical governance board that standardizes protocols across 165 cities, institutional optometry schools that supply the paramedical workforce, and a proprietary software platform handling roughly 20,000 patient encounters daily.3
The generalizable lesson for single-specialty healthcare platforms is that an acquisition roll-up functions as an entry strategy rather than an ongoing operating model. Early acquisitions secured established surgical talent, local referral networks, and immediate geographic footprints across Mumbai, Punjab, and Gujarat. However, those transactions introduced deferred payment liabilities that weighed on balance sheets for years, alongside ongoing physician retention risks. Once Dr. Agarwal's developed a repeatable greenfield framework, management halted M&A. Transitioning from buying external practices to expanding through internal capital deployment marks the point where a roll-up proves whether it possesses a sustainable operating system.
The second lesson concerns the gap between accounting and economics. An asset-light operator leasing its facilities reports an elevated operating margin alongside a single-digit net margin, as lease payments shift from operating costs into depreciation and finance expenses below the EBITDA line. The company's dual disclosure for FY26 — a 28.9% EBITDA margin under Ind AS versus 22.5% on a cash-rent basis — highlights this distinction.1 Comparing an asset-light leaseholder to a freehold hospital operator without adjusting for lease liabilities distorts structural margin comparisons.
What to watch, concretely.
On future earnings calls — public investor presentations and transcripts provide an empirical record for tracking execution over time15: key metrics to monitor include facility-level payback periods and returns on capital employed for the FY24 and FY25 cohorts, representing disclosure areas management has not yet detailed. Analysts should also evaluate whether the Delhi-NCR cluster matches the standard three-year maturation timeline, how capital expenditure moves once the ₹380–400 crore FY27 program is absorbed, and whether the flagship Chennai center, scheduled for commissioning around October 2026, delivers the substantial volume and realization gains projected by management.3
On the corporate merger: management targets mid-November 2026 for final completion.2 Key milestones include final NCLT sanction, share issuance, and whether operational consolidation yields lower corporate overhead and released guarantee liabilities rather than mere organizational chart simplification.
On integration and expansion: investors should track revenue growth in western and northern markets independently from consolidated results, alongside operating losses per greenfield facility. Evaluating these metrics together will indicate whether brand recognition translates into sustainable unit economics in expansion territories.
On the register: monitor remaining private equity sponsor holdings. The August 2026 secondary block trade was absorbed by long-only institutional funds at a premium price,9 but subsequent transactions will indicate whether institutional demand can continuously absorb residual sponsor equity.
A final reflection. Dr. Agarwal's Health Care is less a story of structural moats than one of operational execution within a vast, fragmented market. Its competitive advantages must be re-earned each year through surgical precision, physician retention, and patient referrals. Operating a business without structural lock-in requires continuous execution discipline rather than reliance on passive pricing power. Conversely, it allows a disciplined operator to compound capital over an extended period as an unorganized sector formalizes.
Whether the management team can sustain that execution will be determined by same-store growth trajectory over the next three years far more decisively than by any analytical framework.
References
-
Q1 FY27 Investor Presentation, Dr. Agarwal's Health Care Limited — NSE filing, 2026-08-04 ↩↩↩↩↩↩↩↩↩↩↩↩↩↩↩↩↩↩↩↩↩↩↩↩↩↩↩↩↩↩↩↩↩↩↩↩↩↩↩↩↩↩↩↩↩↩↩↩↩↩↩↩↩↩
-
Q1 FY27 Earnings Conference Call Transcript, Dr. Agarwal's Healthcare Limited — 2026-08-04 ↩↩↩↩↩↩↩↩↩↩↩↩↩↩↩↩↩↩↩↩↩↩↩↩↩↩↩↩↩↩↩↩↩↩↩↩↩↩↩↩↩↩↩
-
Q4 and FY26 Earnings Conference Call Transcript, Dr. Agarwal's Healthcare Limited — 2026-05-21 ↩↩↩↩↩↩↩↩↩↩↩↩↩↩↩↩↩↩↩↩↩↩↩↩↩↩↩↩↩↩↩↩↩
-
Q4 and FY26 Investor Presentation, Dr. Agarwal's Health Care Limited — May 2026 ↩
-
Draft Red Herring Prospectus, Dr. Agarwal's Health Care Limited — BSE, 2024-09-27 ↩↩↩↩↩↩↩↩↩↩↩↩↩↩↩
-
Dr. Agarwal's Health Care IPO analysis: All you need to know — Value Research, January 2025 ↩↩↩↩↩↩
-
Dr. Agarwals Health Care Ltd. IPO — Issue Date, Price, Timeline, Lot Size & Subscription Info — Goodreturns ↩↩
-
Dr Agarwal's Health Care IPO: Allotment Status, GMP, Subscription Details — Outlook Business, February 2025 ↩↩↩↩
-
TPG, Temasek offload 12.63% stake in Dr Agarwals Health Care — Moneycontrol via TradingView, 2026-08-12 ↩↩↩↩↩↩
-
Dr Agarwal's Health Care, Eye Hospital units to merge in strategic consolidation — The Federal, 2025-08-27 ↩↩↩
-
Educator, inventor shapes future of ophthalmology in India, worldwide — Healio Ocular Surgery News, 2012-03-25 ↩↩↩↩↩↩↩↩
-
Mumbai's Aditya Jyot Eye Hospital Merges With Dr Agarwals Eye Hospitals — Dr. Agarwal's Eye Hospital, October 2021 ↩↩↩
-
General Atlantic and Kedaara Capital Lead INR 1,500 Crore Investment in ASG Eye Hospitals — General Atlantic, 2022-07-27 ↩↩↩
-
Dr. Agarwal's Eye Hospital Ltd — BSE India stock quote and filings (scrip code 526783) ↩
 LinkedIn
 WhatsApp
 Reddit
 Hacker News
 Email
Email Kindle
 RSS Feed
 Spotify
 Apple Podcasts
 Amazon Music
 Audible
 YouTube