Lennar: The Land-Light Gamble and the Margin That Fell Off a Cliff
I. Introduction & Episode Roadmap
Picture a Lennar sales office somewhere in the Sunbelt in the summer of 2026. The model home is staged, the granite is polished, and the "Everything's Included" brochure is still on the counter. A young couple sits with a sales agent and a mortgage officer from Lennar's own lending arm. They are not haggling over the kitchen. They are haggling over the monthly payment. The agent offers a mortgage-rate buy-down, then a cut to the base price. By the time the paperwork is signed, Lennar has given away something like 12% of the sticker price in incentives.1
In most businesses that would count as a bad day. At Lennar it was strategy. On the third-quarter call in September 2026, management put it in four words: "we are buying volume."2
That sentence is the doorway into this story. Lennar is the second-largest homebuilder in America, a company that turned $7.8bn of revenue in FY2014 into $34.2bn in FY2025.3 It is run by Stuart Miller, the son of its founder, who is both Executive Chairman and CEO and who controls about 42% of the votes through a class of shares carrying ten votes each.3 And over the past four years it has watched its profitability fall off a cliff.
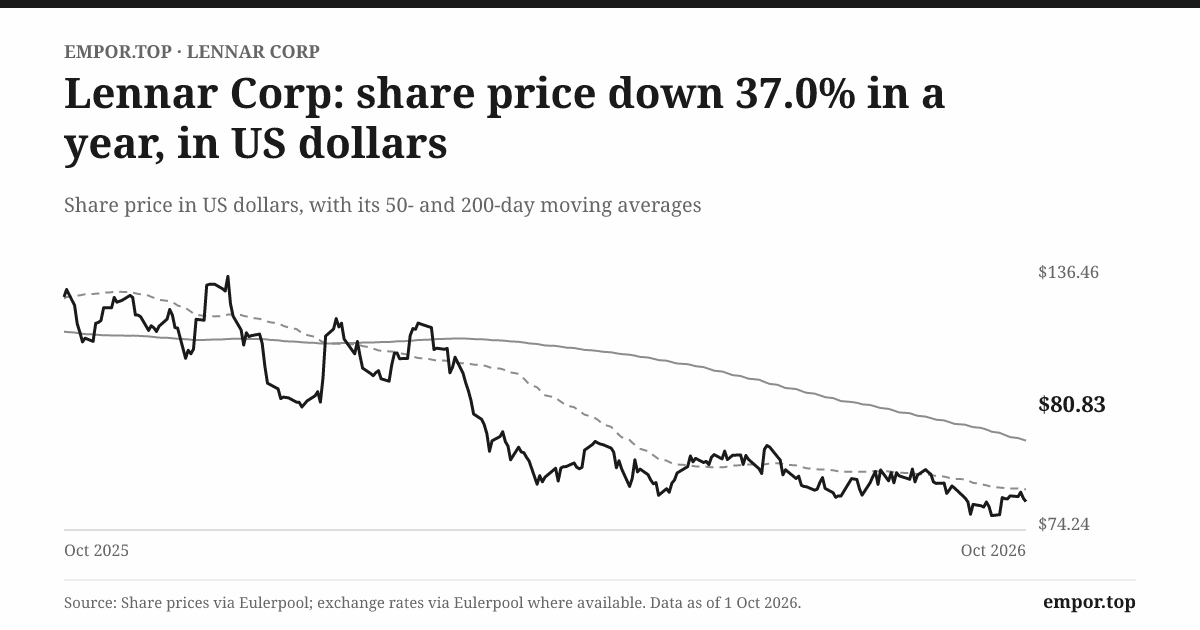
Three numbers frame the fall. In FY2022, at the top of the pandemic housing boom, Lennar earned an operating margin of about 20%. In the quarter to August 2026 that margin was below 6%.13 Earnings per share went from $16.06 at the peak to $5.35 over the last twelve months.31 And on 1 October 2026 the shares sat at $80.83, almost 40% below their 52-week high and slightly below book value per share of about $81.
A stock priced below its book value is the market saying something blunt: it doubts that this equity will earn its cost of capital any time soon. This story asks whether that doubt is right. It does so through four questions that run through every section.
First, is the margin collapse a cycle that will turn, or a reset that Lennar chose for itself through its own pricing and land strategy? Second, is the "land-light" model, built around a spin-off called Millrose Properties, a lasting improvement in returns, or did it simply move land costs into option fees? Third, can the balance sheet carry a long downturn while the company keeps buying back stock? And fourth, does a dual-class company with a founder-family CEO allocate capital for all shareholders, or mainly for itself?
Where the money actually is
Before the history, a quick map. Lennar reports four segments: Homebuilding, Financial Services (mortgage, title and a commercial lending business called LMF Commercial), Multifamily, and "Lennar Other," a bucket of technology and strategic investments.3 Homebuilding is the business. It produces nearly all of the revenue and nearly all of the profit. Financial Services is a valuable sidecar that earns money by writing mortgages for Lennar's own buyers and selling them on. Multifamily builds rental apartments, mostly through funds and joint ventures. Lennar Other is the noise: in the August 2026 quarter it lost $84m, $53m of that from marking investments to market.1
So this is a homebuilding story. When the gross margin on home sales moves a point, nothing else in the company comes close to offsetting it.
The peak was not a plateau
The fact sheet tells a simple story once the noise is removed. Lennar's profit tripled between FY2019 and FY2022, then halved between FY2022 and FY2025, and has kept falling.3 Net profit over the last twelve months, about $1.3bn, is back near where it stood in FY2017–FY2019.1 The 2020–2022 period was a cyclical high caused by a once-in-a-generation combination of near-zero mortgage rates, pandemic migration to the Sunbelt and a shortage of resale homes. It was not a new base.
That matters because investors who bought Lennar in 2021 or 2022 were tempted to treat those margins as the reward of a better business model. The evidence so far says the market gave and the market took back.
The road ahead
The route runs like this. First, a brisk tour of 70 years of history, kept short and aimed at one question: how does this family behave when the cycle turns? Then the CalAtlantic merger of 2018, the biggest deal Lennar ever did. Then the margin collapse itself, decomposed line by line. Then the decision that defines Lennar today: giving away ownership of its land. Then the people running the money, the balance sheet, the lessons, and the bull and bear case. To understand why Lennar was willing to bet the company's shape on that land decision, it helps to start in Miami in the 1950s, with a young man and a few dozen lots.
 Subscribe on LinkedIn
II. Miami to Fortune 500: The Roll-Up Machine, Briefly (1954–2007)
Miami in the mid-1950s was a city being invented in real time. Air conditioning was making the swamp habitable, veterans were arriving with GI Bill mortgages, and builders were pushing west into the Everglades one subdivision at a time. Into that boom stepped Leonard Miller, a young Harvard graduate from Massachusetts who joined a small builder called F&R Builders, run by Arnold Rosen, in 1956.3 The partners' first names, Len and Arnold, eventually became the company name: Lennar. The company adopted that name in 1971 and went public on the New York Stock Exchange the following year.3
The founding instincts are still visible in the company today. Lennar built in the Sunbelt, where population growth was strongest. It built for the middle of the market. And from early on it integrated the pieces around the house: the mortgage, the title insurance, later the closing services. A buyer who walks into a Lennar sales office today and walks out with a Lennar mortgage is living inside Leonard Miller's design.
The first near-death experience
The defining crisis of the early years came in August 1992, when Hurricane Andrew flattened much of south Miami-Dade County. Lennar had thousands of homes in the storm's path, and the wave of repairs and construction-quality claims that followed was a brutal test for a Florida-centred builder. The company survived, and the lesson it took became a habit: when catastrophe hits, stay liquid, take the losses, and use the moment to buy what others are forced to sell.
Lennar spent the 1990s in exactly that mode. It bought distressed real-estate assets from the government's savings-and-loan clean-up, then in 1997 spun those commercial-property and investment activities into a separate public company, LNR Property.3 The same year Stuart Miller, who had grown up around the family business, became CEO. The son of the founder now ran the company his father had built, and the father's voting control passed into the family's Class B shares.
Roll-up years
Stuart Miller's Lennar spent the next decade buying. The largest step was the 2000 acquisition of U.S. Home, a national builder that pushed Lennar far beyond Florida, followed by a string of regional builders across Texas, California and the Carolinas.3 The pattern was clear even then: Lennar grew less by out-building its rivals lot by lot than by buying them when they were cheap.
This is the first trait worth carrying forward. Lennar's growth engine has always been part homebuilder, part acquirer. Scale arrived in lumps.
Survive first
Then came the bust. By 2007 the US housing market was coming apart, and Lennar was holding large amounts of land bought near the top. In late 2007 the company did something that looked like surrender at the time. It sold a majority stake in a portfolio of about 11,000 homesites' worth of land to an affiliate of Morgan Stanley, at a price of roughly 40% of what the land was carried at on Lennar's books.7
Critics called it a fire sale. In hindsight it was the move that kept Lennar alive. It turned illiquid land into cash, booked the pain early, and gave the company the liquidity to buy distressed assets when the cycle bottomed. The same downturn produced Rialto, a distressed-debt investing arm Lennar built to buy bad loans from failed banks, later sold.3
The template set in those years is the one that matters for today's investor. When the cycle turns ugly, Lennar's family-controlled leadership moves fast: it shrinks, sells, takes the hit, and preserves liquidity. It does not wait for a better price. That is a genuine strength, and the 2007 sale is the proof. But it carries a hidden corollary. A company that is good at surviving downturns by selling assets cheaply is not necessarily good at pricing the upturns. The rest of this story will test both halves.
The fact sheet picks up the thread in FY2014, when Lennar was a recovering builder with $7.8bn of revenue, about $4.8bn of equity and more debt than equity.3 Three years later it was still a mid-sized national builder. Then, in the autumn of 2017, Stuart Miller made the biggest bet of his career.
III. The CalAtlantic Bet: Did Lennar Overpay for Scale? (2017–2018)
October 2017. The housing recovery was eight years old, home prices had passed their pre-crisis highs in many markets, and the industry was consolidating. Lennar announced it would merge with CalAtlantic Group, itself the 2015 combination of Standard Pacific and Ryland, two builders with roots going back to the postwar boom.7 The price was about $9.3bn including debt, paid mostly in Lennar stock: each CalAtlantic share received 0.885 of a Lennar Class A share and 0.0177 of a Class B share, with an option to take cash instead, capped at about $1.16bn in total.7
The deal closed in February 2018, and it changed Lennar's size overnight.
What scale looked like
Revenue jumped from $12.6bn in FY2017 to $20.6bn in FY2018, a 63% leap almost all of it bought rather than built.3 Shareholders' equity nearly doubled, from about $7.9bn to $14.6bn, because Lennar issued so many new shares to pay for CalAtlantic.3 Goodwill, the accounting premium paid above the fair value of the assets acquired, settled at about $3.4bn, and it still sits on the balance sheet today.3
Management promised about $250m a year of cost savings, mainly from merging overlapping divisions, cutting duplicate overhead and using Lennar's purchasing power on a larger volume of houses.7 Lennar consolidated CalAtlantic's operations into its own regional structure and applied its "Everything's Included" approach, which bundles features into a standard home rather than selling options, to the combined business. Lennar reported in the following years that the synergy programme was achieved, and the falling ratio of overhead to revenue in FY2019 is consistent with that claim.3
Did it pay?
The fairer test is not whether Lennar got bigger, which it obviously did, but whether shareholders got a better return on their money. Here the evidence is sobering.
Lennar issued a lot of equity to buy CalAtlantic. For that to have been a good trade, the combined company needed to earn a higher return on that larger equity base. It did not. Return on equity was about 10% in FY2017, the year before the deal, and about 11.6% in both FY2018 and FY2019.3 Those are respectable numbers for a homebuilder, but they are below the 13–14% Lennar earned in FY2014–FY2016, before the merger.3
Return on equity only jumped, to about 21% in FY2021, when the pandemic housing boom arrived.3 It then fell back to 9.5% in FY2025 and about 6% over the last twelve months.31 In other words, the merger did not lift the return profile in normal years. It made Lennar a bigger version of the same cyclical business.
Was the price itself high? Homebuilders usually trade and change hands around their book value, sometimes at a modest premium in good markets. CalAtlantic's buyers paid roughly in that range, with the premium to the pre-announcement share price coming mostly in Lennar stock, itself richly valued at the time. The deal was not a reckless overpayment by industry standards. It was a full price paid with an expensive currency.
The later deals
Two smaller deals bookend the CalAtlantic story. In 2017, Lennar bought WCI Communities, a Florida builder focused on retirees and second homes.3 In 2024 it bought Rausch Coleman Homes, a builder of entry-level homes in Texas, Arkansas and the central US, and immediately placed Rausch's land into the new Millrose structure.3 Neither moved the needle on returns in the way CalAtlantic moved revenue.
The verdict
So what did CalAtlantic buy? It bought scale: the purchasing power, the land pipeline and the national footprint that make Lennar the clear number two to D.R. Horton. It bought cost synergies that appear to have been delivered. What it did not buy was a structurally higher return on equity. The peak profit of 2021–2022 came from the market, not the merger, and when the market turned, the bigger Lennar fell just as hard.
That distinction matters because it reframes how to read Stuart Miller as a capital allocator. His mergers built a bigger company. His real discipline has shown up in downturns. And the downturn that began in 2022 was about to test whether a bigger Lennar had also become a better one.
IV. The Margin Collapse: Cycle or Reset? (2022–2026)
Every quarter since late 2022 has had a similar rhythm on Lennar's earnings calls. Stuart Miller, folksy and philosophical, opens with a reflection on the housing market: affordability is stretched, consumers are cautious, rates are stubborn. Then comes the policy statement. Lennar will keep its production pace steady, "even flow," and let the margin absorb whatever the market demands. In the September 2026 call, that policy reached its plainest form. Lennar, management said, is "buying volume."2
To understand what Lennar is buying, and at what price, start with how a homebuilder actually makes money.
The revenue model in one line
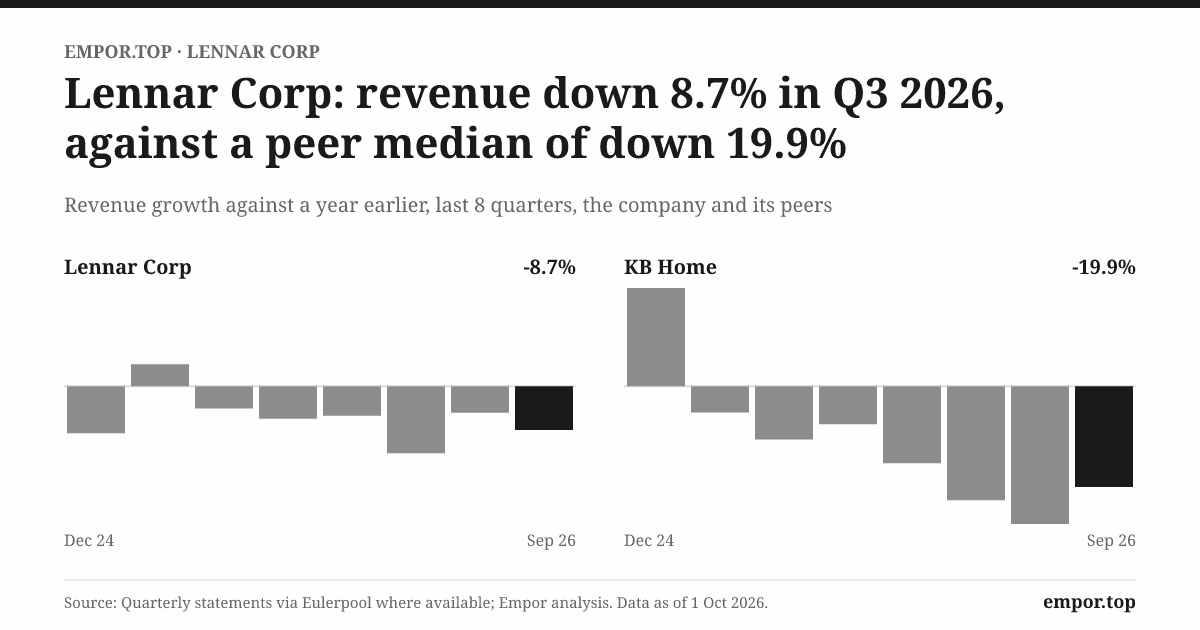
A homebuilder's revenue is homes delivered multiplied by the average sale price. Nothing else matters much. In the third quarter of FY2026, Lennar delivered 20,840 homes, down about 3% on the year before, at an average price of about $372,000, also down about 3%.1 Revenue fell almost 9%.
The leading indicators were weaker. New orders were down about 9%, and the backlog of sold but undelivered homes was 16,857, worth about $6.3bn.1 Management cut its full-year delivery target to 80,000–81,000 homes, from an earlier 82,000–83,000.1 For a company whose entire strategy is built around holding volume steady, cutting the volume target is a meaningful admission: even after paying up, the volume did not fully come.
The margin path
Now the core of the story. Gross margin on home sales, the profit left after land and construction costs, was about 22.3% in FY2024.3 In FY2025 it fell to about 17.7%.3 In the third quarter of FY2026 it was 15.8%, against 17.5% a year earlier.1 Management guided the fourth quarter to 15.5–16.0%.1
Six and a half points of gross margin in two years is a lot. On $30bn of home sales, each point is roughly $300m of pre-tax profit.
Where did it go? Run the decomposition.
Start with volume. Between FY2024 and FY2025, Lennar delivered roughly the same number of homes.3 So the margin did not fall because the company built fewer houses and spread fixed costs over a smaller base. Construction costs actually fell; Lennar's 10-K credits lower building costs as a partial offset.3 That leaves two culprits: price and land.
Price is the big one. Incentives, the rate buy-downs and closing-cost credits and price cuts, reached about 12% of the sale price in the third quarter of FY2026, by management's count.2 Fitch, the rating agency, put it at about 14% of revenue.6 The 10-K describes the result as lower revenue per square foot.3 Before the pandemic, a builder's normal incentive load might have been a few percent. The difference between that norm and today is most of the gross margin gap.
Land is the second culprit, and here Lennar's own words matter. On the third-quarter call, management said land cost per homesite was up about 6%, and tied the cost of extending option deals, the fees Lennar pays to delay taking down land it controls, to what it called the "entire margin gap."2 That is a striking admission. It means part of the margin decline is not the housing cycle at all. It is the cost of the land model Lennar chose.
Below gross margin, overhead piled on. Selling, general and administrative costs rose from about 7.3% of revenue in FY2024 to about 8.3% in FY2025 and 9.2% in the third quarter of FY2026, as revenue fell and fixed costs did not.31 So between FY2024 and FY2025, roughly 4.6 points of the operating margin decline came from gross margin and about 1 point from overhead.3
Prepared remarks against the Q&A
Listen to the calls across FY2025 and FY2026 and a pattern emerges. In prepared remarks, management presents the margin as a deliberate shock absorber, a lever it is pulling to keep its machine running smoothly and its market share intact. In the Q&A, analysts ask the same question in different words: when does the volume buy back the margin? How long do incentives stay this high? What is normal?
The answers have been consistent in tone and vague on timing. Management points to affordability and rates, describes the margin as near its floor, and guides one quarter at a time.2 The guidance itself has had a mixed record: margin guides have broadly been met in recent quarters, but the delivery target was cut in September, and the margin has kept drifting lower over two years rather than stabilising early.12 A sceptic would note that "near the bottom" has been the message for several quarters running.
Is it Lennar or the industry?
The cleanest way to separate cycle from reset is to look at peers. If every builder's margin fell by the same amount, it is the market. If Lennar's fell more, it is Lennar.
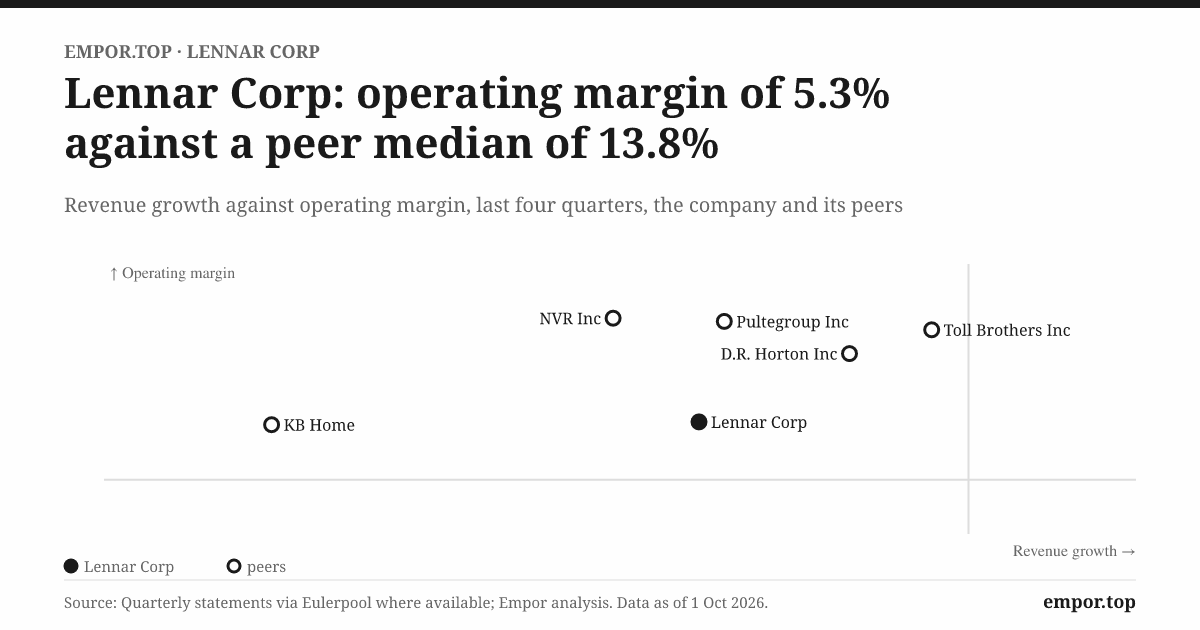
The broad picture from the industry is that all large builders have leaned on mortgage-rate buy-downs since rates rose in 2022, and all have seen gross margins come down from their pandemic peaks. But Lennar's fall stands out. Its peers have generally chosen to protect price and accept lower volume, while Lennar has chosen the opposite. NVR, which has long optioned nearly all its land, and PulteGroup, which leans toward move-up and active-adult buyers, have reported gross margins well above Lennar's mid-teens. D.R. Horton, the largest builder and the closest like-for-like, has also given up margin but held it above Lennar's. Lennar went from having one of the better margins in the industry to having among the weakest of the big builders.
That is the most important clue in the whole margin debate. If Lennar's margin advantage over its peers has gone, the advantage was not structural. It was cyclical, or it was given away.
The moat question, argued once
This is the place to test Lennar's competitive position properly.
Homebuilding is a local, fragmented business. The buyer of a $370,000 house compares a Lennar community with a Horton community down the road and with resale homes in the same school district. Switching costs are zero. Brand matters a little. Mortgage rates matter enormously.
In Michael Porter's terms, buyer power is high, because each buyer is shopping across builders and resale stock and is sensitive to the monthly payment. Supplier power is meaningful in land, where good lots are scarce and land sellers capture much of the value in a hot market, and now, for Lennar, concentrated in one land partner. The threat of substitutes, resale homes and rentals, is real and rises when existing owners finally sell. Rivalry is intense, and it gets worse in a downturn when builders cut prices to move inventory. Barriers to entry are low for a local builder but high for a national one, which needs capital, land pipelines and a mortgage arm.
Hamilton Helmer's 7 Powers framework gives a narrower answer. Lennar has a form of scale economy: it buys lumber, appliances and labour at volume, standardises its plans, and spreads overhead over 80,000 homes a year. That shows up as a cost advantage per square foot. It has a modest process power in its "Everything's Included" standard home, which simplifies construction and purchasing. It has no network effect, no meaningful switching cost and no counter-positioning that rivals cannot copy. It does not hold cornered resources, except perhaps its land pipeline, and that is now increasingly held by someone else.
The test of the scale advantage is simple: does Lennar convert it into higher margins than its peers? In FY2024, when it earned a gross margin of about 22%, the answer appeared to be yes. In FY2026, with the margin in the mid-teens and below larger peers, the answer is no. The scale advantage appears to be real on cost, but Lennar has chosen to pass it, and more, to buyers in exchange for volume.
So the claim that Lennar has a durable cost moat is narrowed rather than rejected. It probably still builds a house more cheaply than most. It no longer earns more for doing so.
Technology, briefly
Lennar talks about technology: its LenX venture arm, dynamic pricing, digital sales and AI. None of it shows up in the financial statements as a profit engine. Lennar Other lost money in the third quarter.1 For now, technology is a story the company tells, not a number investors can measure.
The verdict
Both sides of the cycle-versus-reset debate are partly right, and the evidence says roughly how much. Part of the decline is cyclical: affordability, rates, the end of the pandemic boom, and every builder is feeling it. Part is the cost of Lennar's own choices: a volume-first pricing policy that gives up more margin than peers do, and a land model whose option fees management itself links to the gap. Fitch's forecast of 7–8% EBITDA margins in FY2027, against more than 8% in FY2025, tells you that the agency does not expect a quick snapback.6
The claim that "this is just a cycle" is narrowed. The test is concrete. If the fourth-quarter gross margin lands at or above the 15.5–16.0% guide, and FY2027 brings incentives below 10% of price with margins recovering toward the high teens, the cycle story gains ground. If incentives fall but margins do not follow, the problem is land costs, and the reset story wins. And that brings the story to the decision that shapes every one of those land costs.
V. The Millrose Decision: Land-Light Returns or Moved Risk? (2025–Present)
February 2025. Lennar shareholders open their brokerage accounts and find shares in a company most of them had never heard of: Millrose Properties. Lennar had distributed 80% of Millrose to its own shareholders as a stock dividend, about 121 million Class A and 12 million Class B shares.3 Before the spin, Millrose had acquired about $5.6bn of Lennar's land, roughly 87,000 homesites.3
It was an extraordinary inversion. For seventy years, Lennar's craft had been buying land, holding it, developing it and building on it. Now the company that used to own its land rented the right to buy it.
How the machine works
The mechanics are worth explaining plainly, because they drive everything else.
Think of it like a car lease with a purchase option. Millrose owns the land. Lennar signs a Master Option Agreement that gives it the right to buy finished homesites from Millrose on a schedule, at an agreed price.3 To secure that right, Lennar pays a deposit, about $584m at the spin and another $90m or so when Millrose took on the Rausch Coleman land.3 While it waits, Lennar pays an option fee that works much like interest. When it is ready to build, it buys the lots, builds homes, and sells them.
By the end of FY2025, Lennar's deposits and related costs on Millrose option contracts totalled about $1.0bn.3 Millrose's own filings show the scale of the traffic in the other direction: Lennar exercised options on several billion dollars of homesites from Millrose in FY2025.89
Lennar's 10-K says it relies on Millrose "for a substantial portion" of its homesite acquisition and development.3 It also says other land banks could be substituted if needed.3 Both statements are true, and investors should hold both. Lennar is not trapped, but its largest land supplier is a single, related counterparty.
What the balance sheet gained
The visible gain is dramatic. Owned homesites fell from about 18% of the total to about 2%, while the company still controlled roughly 496,000 homesites.3 By the third quarter of FY2026, fewer than 2.5% of about 488,000 homesites were owned.2 Inventory days, the time Lennar's money sits in land and houses before a sale, fell from about 248 to 140.3 Asset turnover, revenue per dollar of assets, rose to about 1.0, the highest in more than a decade.3 Lennar has turned itself from a land company that builds houses into a manufacturing company that rents its raw material.
What the cash flow shows
Here is the puzzle. In FY2025, Lennar reported net earnings of about $2.1bn. Its cash from operations was about $217m.3 Free cash flow, after a small amount of capital spending, was close to zero.
Where did two billion dollars go? The 10-K shows it clearly. About $1.55bn went into deposits and pre-acquisition costs on real estate, mostly option deposits with Millrose.3 Another $690m or so went into paying down payables and other liabilities.3 Those are operating outflows under accounting rules, because land is inventory for a homebuilder.
So free cash flow is not comparable across the Millrose break. FY2023's $5.1bn of free cash flow and FY2025's near-zero figure measure different businesses. The long record helps: over FY2014–FY2025, Lennar turned about 75% of its reported profit into operating cash, but in FY2025 alone that ratio was about 10%.3
Is it a better model?
This is the core question, and it is not settled by the balance sheet.
Land-light is only a better model if the cost of renting land, the option fees and the price premium Millrose earns on its capital, is smaller than the value of the capital Lennar no longer has to tie up. Picture two builders. One owns its land and earns the full development profit but ties up capital for years. The other options its land, pays someone else to hold it, and turns its capital fast. The second earns a lower margin on each house but a higher return on each dollar, if the fee is reasonable.
NVR, which has optioned nearly all its land for decades, is the classic proof that the second model can work superbly. But NVR built that model over decades with many land sellers and a tight discipline about walking away from deposits. Lennar built its version in one transaction, with one dominant partner it created and then spun out.
The current scorecard is not flattering. Return on equity was 9.5% in FY2025 and about 6% over the last twelve months.31 And management itself has tied option-extension fees to the margin gap.2 For now, that is evidence against the claim that land-light is creating superior returns. It is not yet proof of failure, because the deposit build-up has distorted the cash figures and the margin is depressed for cyclical reasons too.
So the model is intact but unproven. The test is FY2026 and FY2027: once the deposit build stops, does free cash flow approach net profit, and does return on equity recover toward the low teens? Millrose's own disclosures of option fees and land prices against Lennar's gross margin will show who is keeping the value.
The accounting judgement
There is one more layer. Lennar concluded that it does not control Millrose and therefore does not need to consolidate it onto its balance sheet. Its auditor made that conclusion, the variable-interest-entity assessment, a critical audit matter, the auditor's flag for the most judgement-heavy area in the accounts.3
This is not a red flag about fraud. It is a flag about how much the picture depends on a judgement call. If Lennar had been deemed Millrose's controlling party, Millrose's billions of land and debt would have come back onto Lennar's balance sheet, erasing much of the land-light improvement in the ratios. Investors should know that the cleaner balance sheet rests on an accounting conclusion an auditor judged worthy of special mention.
Unwinding the last 20%
In November 2025, Lennar disposed of most of its remaining stake through an exchange offer. It accepted about 8 million of its own Class A shares in return for about 33 million Millrose shares.3 Lennar booked a one-time loss of about $156m and its equity fell by about $1.1bn.3 By 28 November its stake was de minimis.3
That exchange functioned as a disguised buyback: Lennar retired its own shares using Millrose stock rather than cash. Combined with the spin-off, it explains why shareholders' equity fell from about $27.9bn to $22.0bn in a single year.3 Value was not destroyed in that amount; it was handed to shareholders as Millrose shares. But it does mean the company now earns its returns on a smaller equity base, which should flatter ROE. That ROE still fell is the sharper point.
The other lever: Financial Services
The mortgage and title business is the quieter half of the integration. It hedges its pipeline of loans against rate moves and funds them on warehouse lines, about $3.0bn of which needed renewal in FY2026.3 In the third quarter its profit was helped by a one-time $39m reversal of a litigation accrual.1 It is a dependable profit contributor, but it rises and falls with Lennar's own home deliveries and with the buy-downs Lennar finances. When the company pays a buyer's rate down, part of the subsidy runs through this segment. It is a lever, not a hedge.
Land-light is the boldest structural decision any large builder has made in a generation. Whether it was a good one depends partly on the people who made it, and on how they decided to use the capital it freed.
VI. Who Is Running the Money? Miller, Pay, and Capital Allocation
Open Lennar's 2026 proxy statement and the first figure that catches the eye is in the compensation table. In FY2025, the year net profit fell about 47%, Stuart Miller's total pay was about $29.5m.5 Most of it, about $25.7m, came in stock awards. His salary was $1.0m and his cash incentive about $2.8m.5
Then turn to the ownership pages. Miller controls about 42% of Lennar's votes, largely through Class B shares that carry ten votes each.35 Class A shares carry one.
Those two facts frame the governance question. A founder-family CEO with near-control can act quickly and think in decades. He can also be paid generously in a bad year and face little real pressure from outside.
The man
Stuart Miller is unusual among homebuilding CEOs. He has spent almost his whole career in his father's company, has run it for nearly three decades, and talks on earnings calls more like a philosopher of the housing market than an operator reciting KPIs. He shifted to Executive Chairman in 2018, after the CalAtlantic merger, handing the CEO role to longtime colleague Rick Beckwitt, while Jon Jaffe served as President.7 When Beckwitt stepped down, Miller took the CEO title back and has held both roles since.7 Jaffe, the operational builder of the team, retired at the end of December 2025.3 That leaves Miller more central than ever, and succession more opaque than investors might like. The proxy names no heir.
The family's footprint inside the company is small in dollar terms. Miller's son Brad earned a $300,000 salary and about $439,000 bonus.5 Aircraft time-sharing for Miller was about $1.0m.5 The Miller family office reimbursed Lennar about $762,000 for administrative services.5 Against $34bn of revenue these are rounding errors. They matter as signals of how blurred the line between family and company can be, not as costs.
Pay against performance
Lennar's pay design has defensible features. About 70% of Miller's equity is performance-based and 30% time-based.5 There are no employment contracts and a clawback policy is in place.5 Eight of nine directors are independent, and the lead independent director is Armando Olivera.5 Shareholders gave about 88% support to the pay plan in 2025.5
But the scale of pay in a year of halving profit is hard to defend on outcome alone. The performance shares are measured against metrics such as returns and relative performance over multi-year periods, which means a bad year can still pay out on a prior period's strength. A sceptic would say the structure rewards a CEO well through both halves of the cycle. The 2025 say-on-pay vote did not reflect a revolt, but 12% opposition with a near-controlling insider voting in favour implies notably higher dissent among outside holders.
The buyback problem
The cleanest capital-allocation test is the price at which Lennar bought its own stock.
In FY2024, Lennar spent about $2.15bn buying back about 13.6 million shares, at an average around $151–159.3 In FY2025 it spent about $1.73bn on about 14.1 million shares at around $123.3 On 1 October 2026 the stock was at about $81.
Every one of those dollars bought shares at prices well above today's. For the continuing holder, those buybacks transferred value to the shareholders who sold. That is not a scandal; buybacks are always a bet on the future. But it is a fair verdict on timing: Lennar bought back most aggressively near the top of the cycle, with cash generated by peak margins, and it bought less once the price fell. In the third quarter of FY2026 it repurchased about 3 million shares for about $256m, alongside about $119m of dividends.1
Dividends tell a parallel story. Lennar pays $2.00 a share a year.3 That consumed about 25% of FY2025 profit, against a payout ratio of about 3% in FY2019.3 The dividend did not rise much; earnings fell under it.
The activist stress test
Imagine a sceptical activist with a stake in Lennar. What would they push on?
First, cash. Homebuilding cash fell from about $3.4bn at the end of FY2025 to about $1.2bn by the end of August 2026, while homebuilding debt stood at about $4.3bn.31 Lennar was still buying back stock and paying dividends. The activist would ask why the company is returning capital while its cash cushion falls and its operating cash flow is near zero.
Second, the Millrose structure. It moved the company's largest supply relationship outside the corporate walls into a company that Lennar created and whose economics Lennar shareholders cannot fully see from Lennar's own accounts.
Third, guidance. Management cut its delivery target in September and has watched margins slide for two years while describing the trough as near.
The defence is real too. Lennar's management survived 2007–2010 by acting faster than most rivals. Its covenant headroom is wide. Its governance has the standard protections. And a founder who owns a large stake bears the cost of bad buybacks alongside everyone else.
The verdict
The record says Miller is strongest when the cycle forces his hand: selling land in 2007, staying liquid, cutting when needed. He has been weaker at pricing the cycle on the way up, as the buybacks show. The claim that this dual-class company allocates capital for all holders is narrowed, not rejected. The test is a multi-year comparison of CEO pay against earnings per share and returns, and whether the buyback pace slows while cash and free cash flow remain thin. Which leads to the balance sheet, and whether it can bear both a downturn and the payouts.
VII. Can the Balance Sheet Carry a Long Downturn? (Liquidity and Credit)
On 5 June 2026, Fitch Ratings published a short note that told the market more about Lennar than most earnings calls. It affirmed Lennar's BBB+ rating and moved the outlook from positive to stable.6 A year earlier, Fitch had been pointing toward an upgrade. Now it was pointing at margin compression, incentives of about 14% of revenue, and leverage drifting toward the 2.0x level that would put the rating under pressure.6
Fitch forecast EBITDA margins of about 6–7% in FY2026 and 7–8% in FY2027, against about 8.4% in FY2025.6 It estimated leverage, debt against EBITDA, at about 2.2x, above its own 2.0x sensitivity.6 Rating agencies rarely move fast. This one moved because the recovery it had expected did not arrive.
Survival is not the question
On the narrow question of solvency, Lennar is in no danger. Its bank covenants require a minimum net worth of $10.0bn; it had about $16.0bn on the covenant definition at the end of FY2025.3 The leverage covenant caps debt at 60% of capitalisation; Lennar was at about 7%.3 Debt to equity on the fact sheet was about 0.29, up from 0.16 a year earlier mainly because equity fell after the Millrose spin, not because the company borrowed heavily.3 Senior notes were about $2.1bn at FY2025, and Lennar redeemed $400m of 5.25% notes in the third quarter of FY2026.31 The average interest rate on homebuilding debt was about 5.1%.3
That is a strong position. Lennar has also proved, in 2007–2010, that it will sell assets at a steep discount rather than risk the company. That history is the most useful data point for investors trying to imagine a severe downturn: Lennar's instinct is to shrink and survive, not to borrow and hope.
The real question
The question is not whether Lennar survives. It is whether the cash it returns to shareholders fits the cash it earns. On current numbers, it strains.
FY2025 free cash flow was close to zero, for the reasons described in the Millrose section.3 Homebuilding cash fell sharply through FY2026.1 Interest income on Lennar's cash dropped from about $165m in FY2024 to about $54m in FY2025, a direct measure of the shrinking cash pile.3
The balance sheet also carries some noise. The "Investments" line on the fact sheet grew to about $9.3bn by FY2025, mostly stakes in joint ventures and unconsolidated entities, including Multifamily funds and land ventures.3 Lennar Other recorded about $130m of mark-to-market gains in FY2025 that flattered profit, and those gains turned to losses in FY2026.31 Equity securities in Lennar Other fell from about $347m to $203m between November 2025 and May 2026.4 None of these items threaten the company. They do make reported profit noisier than the homebuilding engine underneath.
The quiet liabilities
Warranty reserves, money set aside for future repairs, were about $401m at the end of FY2025, down from about $446m.3 Lennar describes construction-defect claims as ordinary course and not material.3 Hurricane Andrew is the historical reminder that construction-quality claims can become material for a builder concentrated in storm country. For now, nothing in the filings suggests that risk is live.
Credit beyond Fitch
Lennar holds investment-grade ratings from all three major agencies. The 10-K notes that a downgrade would raise funding costs and could affect access to surety bonds, which builders need for municipal infrastructure commitments.3 Neither Moody's nor S&P has publicly signalled a downgrade, but the Fitch outlook change is the canary.
The verdict
The claim of financial strength stands for survival. "Strength while buying back stock at $123" is unproven, because the buybacks were funded in part by a cash pile that has since shrunk and by operating cash flow that has nearly vanished. The test arrives at the November 2026 results: homebuilding cash at year end, FY2026 free cash flow once option deposits stop building, and any change in Fitch, Moody's or S&P's view. Those are the numbers that will decide whether the playbook of the past few years was discipline or bravado.
VIII. Playbook: Business & Investing Lessons
"Sell the land, keep the houses." Millrose is the most radical bet in Lennar's history: a company that spent seventy years mastering land gave it away to its own shareholders in a single stock dividend. The lesson is not that land-light is wrong. It is that land-light is a financing decision dressed as a strategy. Renting your raw material frees capital, but the landlord wants a return, and that return comes out of your margin. A land-light builder earns its keep only if it turns the freed capital into something worth more than the fee. For investors, the check is simple: watch whether return on equity rises when the balance sheet shrinks. If it does not, the capital was moved, not saved.
"The shock absorber is the margin." Lennar's volume-first philosophy, even flow, steady production, keep the machine humming, sounds like operational wisdom. In practice it means that whenever demand weakens, shareholders pay the bill in the form of incentives. Lennar gave away about 12% of its sticker price to keep its pace.2 Smooth volume and smooth profits are not the same thing; one is often bought with the other. A company that tells you its margin is a shock absorber is telling you who absorbs the shock.
"Buy back when it hurts." Lennar spent close to $4bn on its own shares in FY2024 and FY2025 at prices between about $123 and $159.3 Today the stock trades near $81. The lesson is old but rarely obeyed: buybacks funded by peak cash flows at peak prices transfer wealth to the sellers. The best buyback is the one that feels uncomfortable, when the stock is cheap and the outlook murky. Lennar's buying slowed exactly when its shares became cheaper.
"Scale is not a moat." CalAtlantic made Lennar the second-largest builder in America and delivered its cost savings. It did not deliver a higher return on equity in normal years, and it did not stop the margin collapse of 2023–2026. Scale in a local, fragmented, rate-sensitive business buys purchasing power. It does not buy pricing power. Founders who chase size in commodity industries should know what they are buying.
"Survive first." In late 2007, Lennar sold a large land portfolio at about 40 cents on the dollar of book value.7 It looked like capitulation. It was the decision that let Lennar live through the worst housing crash in modern history and come out buying. Of all Stuart Miller's moves, that one has aged best. The lesson for every cyclical business: liquidity is the only asset that never needs a buyer.
And one more, about the family. Founder control gives Lennar speed. The 2007 sale, the CalAtlantic deal and the Millrose spin each happened faster and more boldly than a widely held company could likely have managed. The same speed means the bets are large and the checks are few. Founder control is an accelerator. It goes in both directions.
IX. Analysis: Bull vs. Bear and What to Watch
On 1 October 2026, Lennar's shares closed at about $80.83, close to their 52-week low of $77.57, and just under book value per share of about $81.45. The market was valuing the second-largest homebuilder in America at less than the accounting value of its assets minus its liabilities.
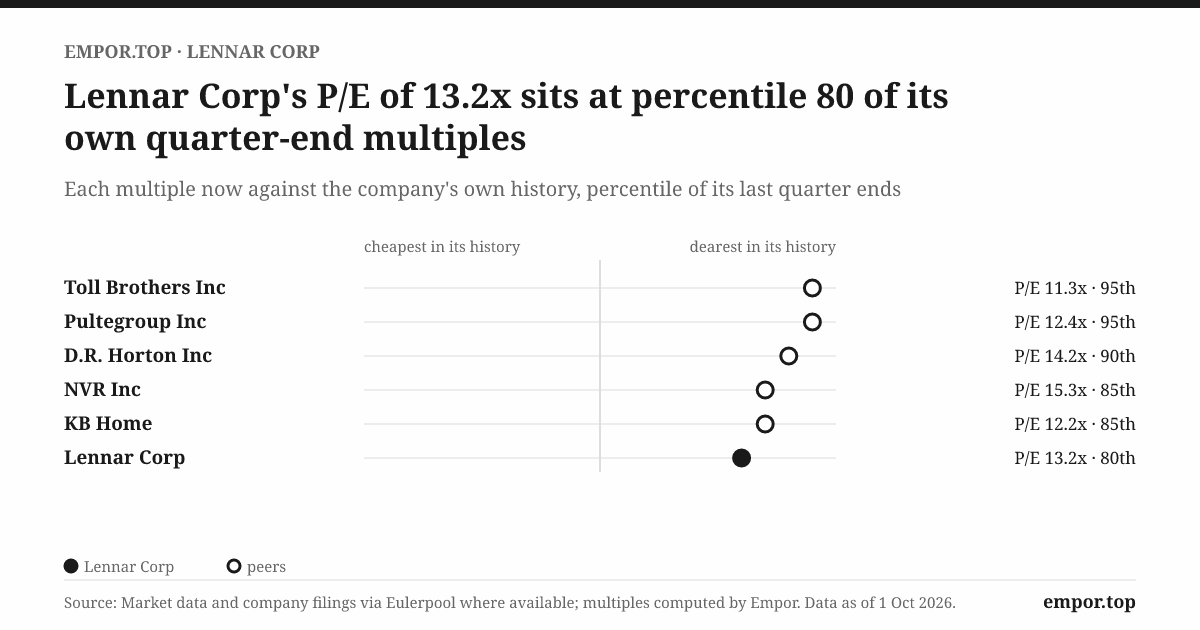
The other valuation markers look contradictory at first. The price-to-earnings multiple was about 13 times trailing earnings, well above Lennar's own five-year median of about 8 times. EV/EBITDA was about 12.5 times. The dividend yield was 2.5% and the free cash flow yield about 3.8%. Return on equity was about 6%.13
The contradiction resolves once you see that earnings are depressed. A P/E of 13 on trough earnings is not expensive in the way 13 times peak earnings would be. A price below book, meanwhile, says the market expects Lennar to earn less than its cost of equity for a while. Investors are not paying for the assets; they are discounting the returns on them.
The bull case
The bull starts with supply. America has underbuilt homes for more than a decade, and household formation keeps outrunning completions. When rates ease or incomes catch up, demand for entry-level housing, Lennar's core market, should recover.
Second, the land-light model has not yet shown its cash. FY2025's near-zero free cash flow was distorted by more than $1.5bn of option deposits.3 Once those deposits stop building, cash from operations should converge toward net profit, and buybacks at around book value would then be accretive in a way the 2024–2025 buybacks were not.
Third, the book value floor. Homebuilders trading below book have historically been near cyclical lows, and Lennar's book is mostly land deposits, homes under construction and investments rather than intangibles, apart from goodwill.
Fourth, the balance sheet. A BBB+ rating, wide covenant headroom and low leverage mean Lennar can wait out the cycle.63
The bear case
The bear starts with affordability. Mortgage rates and home prices together have priced many first-time buyers out, and the incentives needed to close the gap, 12–14% of price, have become structural for Lennar.26 If they stay, the margin stays down.
Second, the lost margin advantage. Lennar's gross margin used to be among the best of the big builders. It is now among the weakest. If the gap reflects strategy rather than cycle, it may not close when the market improves.
Third, the land model's cost. Management has tied option fees to the margin gap.2 If land-light means permanently paying a premium for land, the model swaps a capital-heavy, high-margin business for a capital-light, low-margin one, and the arithmetic of return on equity becomes a race.
Fourth, concentration and governance. A single related counterparty supplies a substantial portion of Lennar's land.3 The accounting that keeps it off the balance sheet is a critical audit matter.3 And the person who designed the structure controls 42% of the votes.
Fifth, SG&A deleverage. At 9.2% of revenue, overhead is eating more of a smaller margin.1
The risk radar
Only four risks are material enough to watch closely. The first is a demand shock from mortgage rates and affordability, which works through a simple mechanism: higher rates force bigger buy-downs, and every buy-down comes out of gross margin. The second is land-cost inflation and option fees, which feed straight into cost of sales. The third is land-supply concentration in Millrose: if the relationship sours or Millrose's own financing tightens, Lennar's land pipeline is exposed. The fourth is the renewal of roughly $3.0bn of mortgage warehouse lines, routine in normal markets but a pinch point if credit tightens.3
Myth versus reality
The myth is that Lennar is a structurally superior builder whose margins will snap back with the cycle. The reality is more mixed. Lennar has a real cost advantage from scale and standardisation, but it no longer turns that into a margin advantage, and its own management blames part of the gap on its land structure. The other myth, held by the bears, is that land-light was a gimmick. The reality is that the balance sheet is genuinely lighter and the inventory turns genuinely faster. What is unproven is whether the shareholders, rather than the landlord, keep the gain.
The KPIs that decide it
Three numbers matter more than all others.
Gross margin on home sales. Latest reading: 15.8% in the third quarter of FY2026, down from 17.5% a year earlier, with a fourth-quarter guide of 15.5–16.0%.1 Direction: down for two years. This is the single best gauge of whether Lennar's pricing and land costs are recovering.
Incentives as a share of price. Latest reading: about 12% by management's measure, about 14% by Fitch's.26 Direction: elevated and not yet falling. If this drops without the margin rising, land costs are the problem.
Homebuilding cash and free cash flow after deposits. Latest reading: homebuilding cash of about $1.2bn at the end of August 2026, down from about $3.4bn, and FY2025 free cash flow close to zero.13 Direction: down. This is where the land-light thesis is proved or disproved.
Return on equity and cash conversion follow from those three. If the first two recover and the third stops falling, the market's below-book verdict will look too harsh. If not, it will look accurate.
X. Epilogue
Tonight, Lennar is a company in the middle of an argument with itself. It has redesigned its balance sheet, given away its land and its largest spin-off, and staked its strategy on volume in a market that rewards margin. Its shares trade below book. Its rating outlook has been trimmed. Its founder's son still runs it, alone now at the top.
The next chapter is short and dated.
In December 2026, Lennar will report its fourth quarter and full FY2026, and give its first guidance for FY2027. The gross margin against the 15.5–16.0% guide is the headline number.1 If it comes in at the top of the range and FY2027 guidance points to margins in the 17–18% area with incentives easing, the cycle story wins ground and the market's assumption of subpar returns starts to look too pessimistic. If margins stay flat while incentive spending falls, the remaining gap is land cost, and the reset story wins.
The same results will show homebuilding cash at year end and FY2026 free cash flow, the first clean read on whether land-light actually releases cash once the deposit build-up ends. A strong cash number would be the first real evidence that the Millrose decision is paying off for Lennar shareholders, rather than for Millrose's.
The rating agencies will speak too. Fitch's 2.0x leverage line is close. A move by Fitch, Moody's or S&P in either direction would tell investors how outside creditors read the balance sheet that management describes as fortress-like.
Millrose's own disclosures will add a second lens: the option fees it charges and the prices at which it sells land to Lennar, compared with Lennar's gross margin. That is where the value split between landlord and tenant becomes visible.
And in the spring, the next proxy and the say-on-pay vote will show whether outside shareholders are willing to keep paying a CEO generously through a profit halving, or whether dissent finally rises above the founder's voting block.
Each outcome maps onto the four questions this story began with. Cycle or reset: the margin and incentives. Land-light or moved risk: the cash flow and Millrose's fees. Balance-sheet strength: the cash, the ratings and the buyback pace. Governance: the pay vote. None of these will be settled in a single quarter. All of them will be moved by the next two.
The tension that remains is the one built into Lennar's choices. It has staked its model on volume and on rented land, in a business that investors ultimately judge by margin and return on equity. That works beautifully in a rising market. Whether it works in a flat one is the question Lennar is now answering in real time.
XI. Outro
Go back to that sales office. The couple got their house. Their monthly payment was bought down, their price was cut, and they walked out with a mortgage from Lennar's own lender. Lennar got its delivery, its even flow, its unbroken production pace. What it gave away was the margin, about 12 cents of every dollar of sticker price, and its shareholders paid for it.
That is Lennar in a single transaction. It spent seventy years learning how to own land: buying it cheap, holding it through storms and busts, selling it at 40 cents on the dollar when survival demanded. Then, in 2025, it handed that land to its own shareholders and became a company that rents the ground it builds on. Whether that made Lennar a better homebuilder, or just a lighter one, is a question that the story cannot answer. The earnings will.
References
-
Lennar Reports Third Quarter 2026 Results — Lennar Newsroom, 2026-09-16 ↩↩↩↩↩↩↩↩↩↩↩↩↩↩↩↩↩↩↩↩↩↩↩↩↩↩
-
Lennar Q3 2026 Earnings Call Transcript — StockAnalysis, 2026-09 ↩↩↩↩↩↩↩↩↩↩↩↩
-
Lennar 2025 Annual Report (Form 10-K, FY ended 2025-11-30) — Lennar ↩↩↩↩↩↩↩↩↩↩↩↩↩↩↩↩↩↩↩↩↩↩↩↩↩↩↩↩↩↩↩↩↩↩↩↩↩↩↩↩↩↩↩↩↩↩↩↩↩↩↩↩↩↩↩↩↩↩↩↩↩↩↩↩↩↩↩↩↩↩↩↩↩↩↩↩↩
-
Lennar outlook revised to stable by Fitch on margin pressure — Investing.com, 2026-06 ↩↩↩↩↩↩↩↩↩
-
Lennar filings list (10-K, 10-Q, 8-K, proxy and merger filings) — SEC EDGAR ↩↩↩↩↩↩↩
 LinkedIn
 WhatsApp
 Reddit
 Hacker News
 Email
 Kindle
 RSS Feed
 Spotify
 Apple Podcasts
 Amazon Music
 Audible
 YouTube